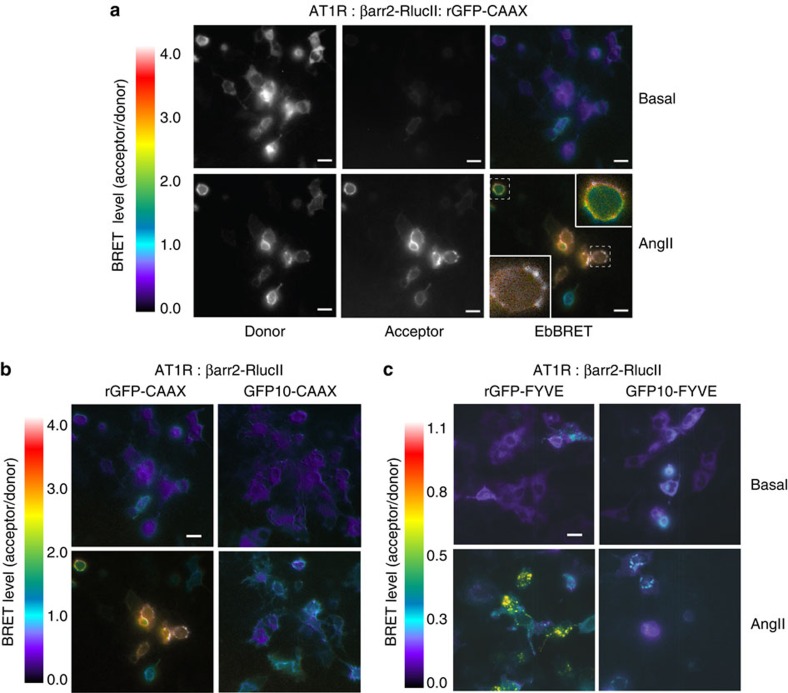
Figure 4. Imaging EbBRET for β-arrestin2 trafficking in response to AT1R stimulation.
(a) HEK293 cells were transfected with AT1R, βarr2-RlucII and rGFP-CAAX. Luminescence images were acquired after the addition of the luciferase substrate, Prolume Purple coelenterazine, using the optical filters for BRET donor (370–450 nm) or acceptor (longer than 480 nm). Exposure time was 90 s for each picture. To generate BRET images, the ratio of acceptor photon counts to donor photon counts was calculated for each pixel and expressed as a color-coded heat map (lowest being black and purple, and highest red and white; see heat-map legend). Cells were treated (bottom panels) or left untreated (top panels) with 100 nM AngII for 10 min at room temperature (RT). Images show BRET signals of the same cells before and after the treatment with AngII. Insets show magnified images of cells from dashed boxes. (b,c) HEK293 cells were transfected with AT1R, βarr2-RlucII and either rGFP-CAAX or GFP10-CAAX (b), or with either rGFP-FYVE or GFP10-FYVE. (c) Luminescence images were obtained and BRET images generated after 10 min at RT (b) or 1 h at 37 °C (c) AngII (100 nM) stimulation as described in the Methods section. The numeric scale of the heat-map legend represents calculated BRET ratios. Scale bars, 20 μm.

