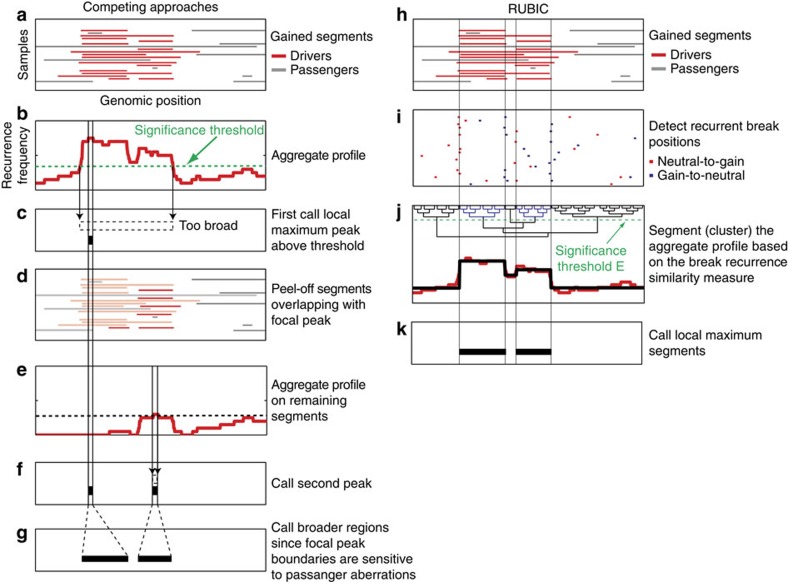
Figure 1. Algorithmic steps of competing approaches and RUBIC.
(a) A heat map of the gains in simulated copy number profiles for 20 samples. Segments that activate oncogenes (driver aberrations) are shown in red and passenger aberrations in grey. (b) The copy number profiles in a are aggregated (summed) to produce the aggregate gain profile. The dashed line represents a significance threshold based on a null model, obtained by, for example, permutation of the probe indices in a. (c) The calling of the maximum peak in the aggregate profile within the genomic region where the aggregate profile exceeds the significance threshold. (d) Copy number segments overlapping with the maximal peak are removed from the data set. (e) Based on the adapted data set, a new aggregate profile and significance threshold are computed. (f) As in c, a maximum peak is called in the adjusted aggregate profile. (g) Finally, a post processing step is employed to broaden the peaks and improve the probability of including the correct driver genes. (h) The same input data set depicted in a. (i) Positions of recurrent breaks in the copy number profiles. Neutral-to-gain breaks are depicted in red and gain-to-neutral breaks in blue. (j) The segmented profile (in black) resulting from performing hierarchical clustering on the aggregate profile (in red). During clustering, RUBIC employs the expected Euler characteristic as similarity measure, thus allowing termination of the clustering when all segments are separated by significant breaks with similarity measures below a fixed, predetermined threshold (green dashed line). The dendrogram resulting from clustering the aggregate profile is also depicted, with the significance threshold used as cutoff to produce the depicted segmentation. (k) Local maximum segments are called and such segments are expected to contain putative oncogenes.

