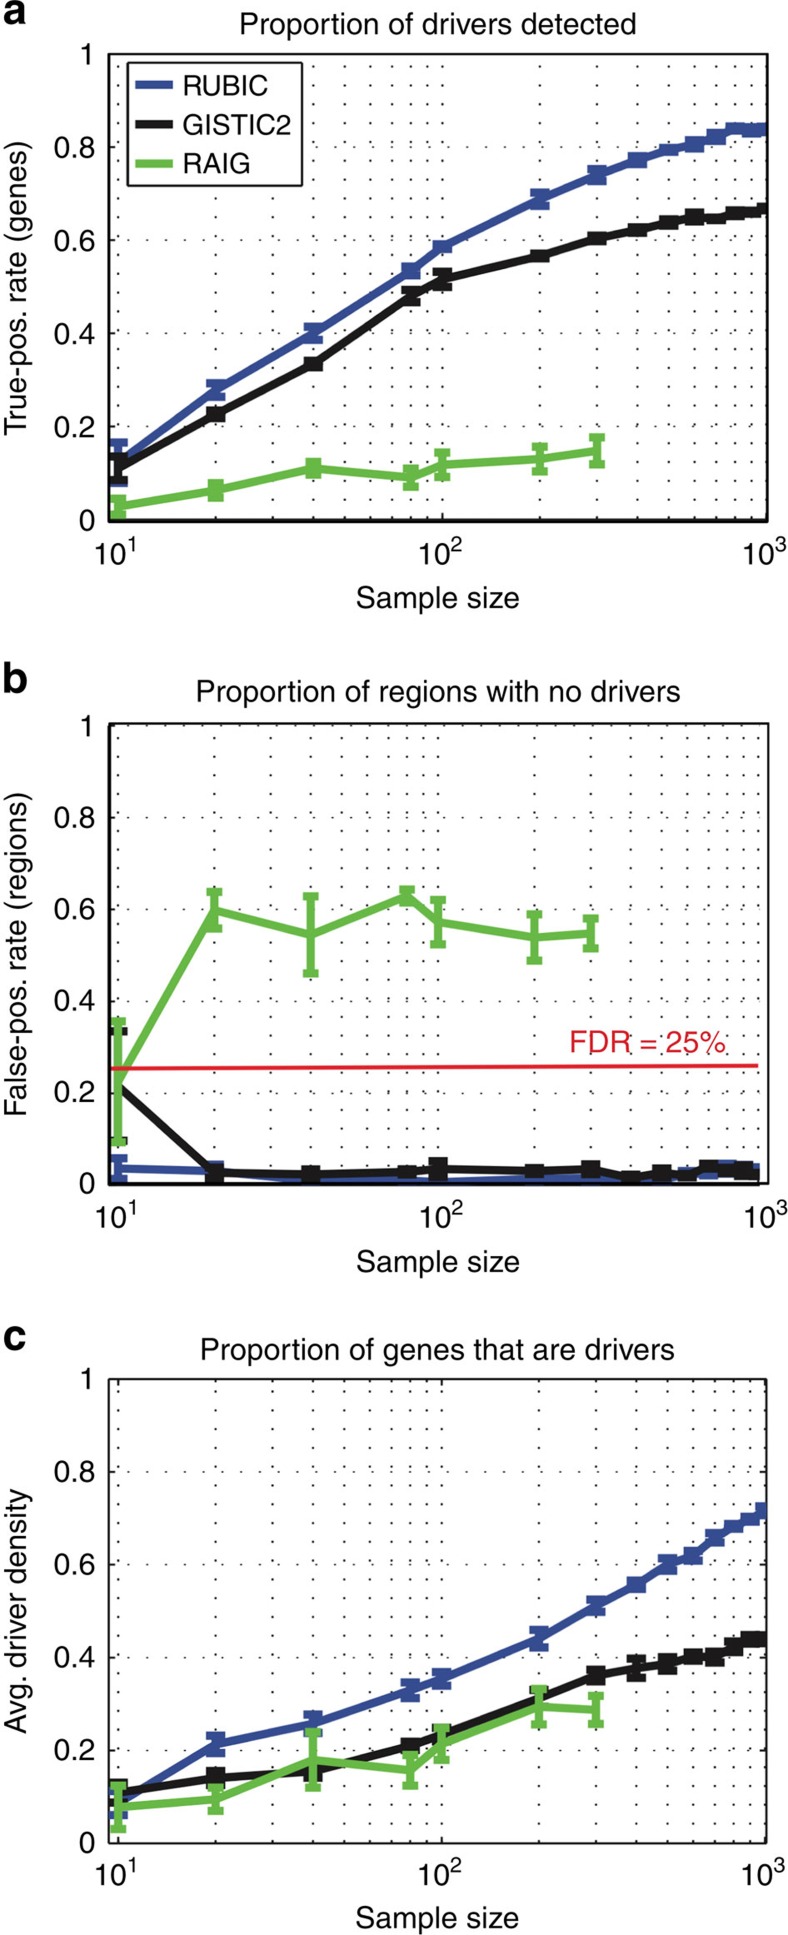
Figure 2. Performance on simulated data.
The performance of RUBIC, GISTIC2 and RAIG at recovering driver genes in simulated data for different sample sizes (represented on the x axes). (a) Proportion of (known) driver genes that overlapped with called recurrent regions. (b) Proportion of called recurrent regions that overlapped with none of the driver genes. (c) Average (across called regions) proportion of genes that are drivers within each called recurrent region. Error bars represent the s.e. based on five samplings.

