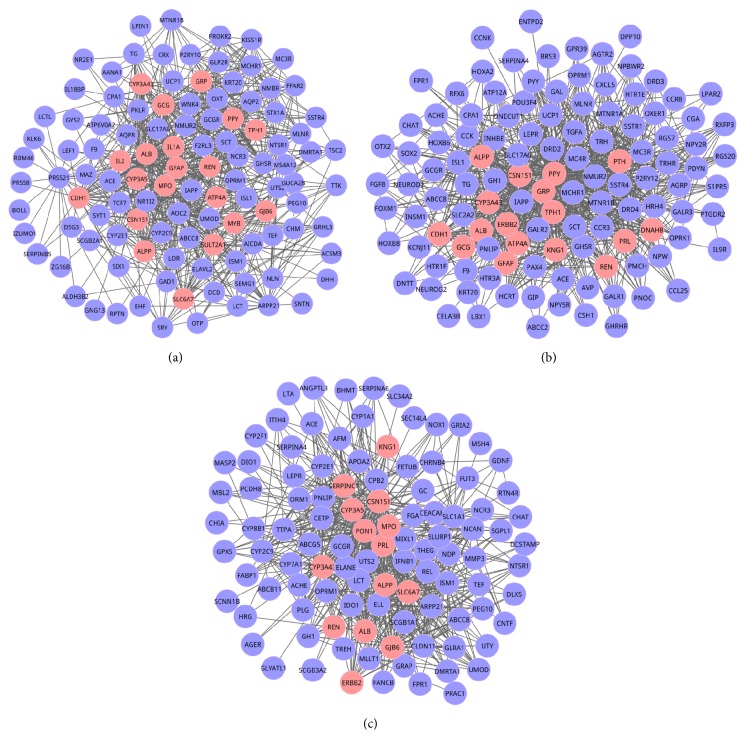
Figure 1.
The 3 key modules identified in the differential coexpression network (DCN) of baseline and propofol group based on the adjusted P values by attract method. (a), (b), and (c) represented module 1, module 2, and module 3, respectively. Nodes were genes, and edges were the interactions among two genes. There were 119 nodes and 866 edges in module 1; 112 nodes and 766 edges were contained in module 2; module 3 consisted of 105 nodes and 649 edges. The pink nodes were seed genes.

