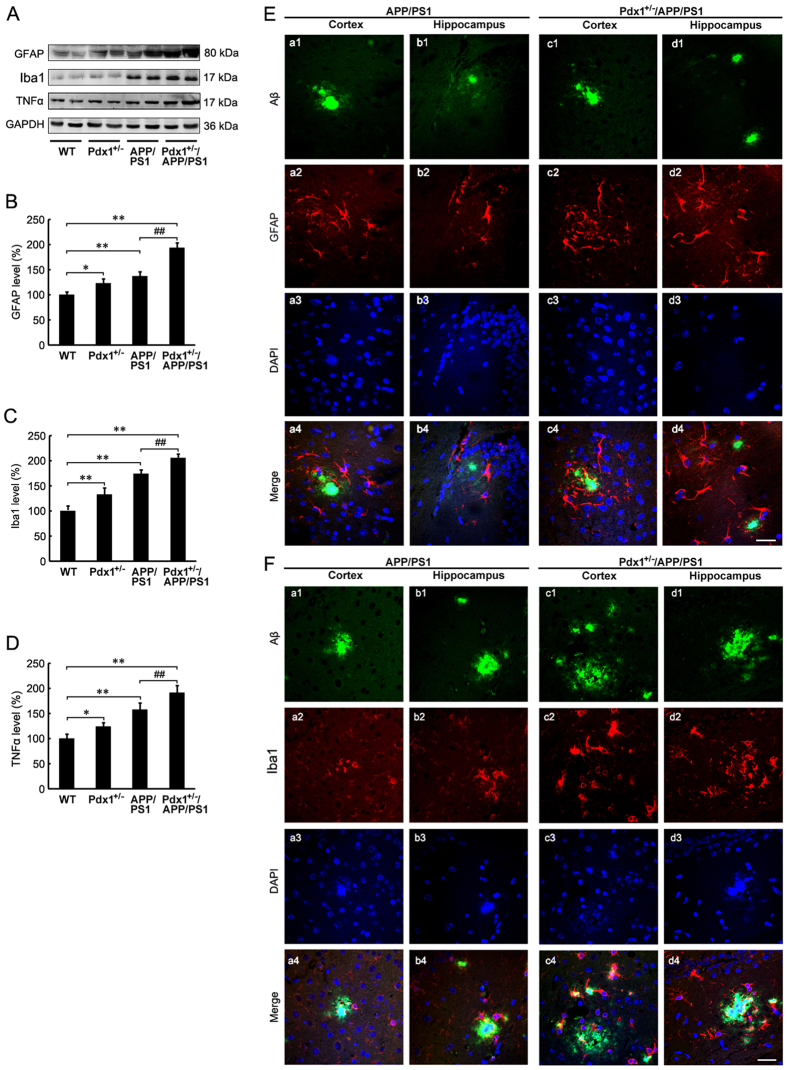
Figure 8. Increased neuroinflammation in Pdx1+/−/APP/PS1 mouse brains.
(A) Western blots demonstrating the protein levels of GFAP, Iba1 and TNFα in the brains of Pdx1+/−, APP/PS1, Pdx1+/−/APP/PS1, and WT littermate mice at 41 weeks of age. GAPDH was used as an internal control. (B–D) Quantification revealed that the levels of GFAP, Iba1 and TNFα were significantly increased in the brains of the Pdx1+/−/APP/PS1 mice compared with the APP/PS1 mice. Immunofluorescence labeling and confocal microscopy analysis showing the distribution and expression of Aβ (a1-d1) and GFAP (E) and Iba1 (F) (a2-d2) in the cortex and hippocampus of the APP/PS1 and Pdx1+/−/APP/PS1 mouse brains. The images are representative of three independent experiments. Scale bar, 20 μm. Data represent the mean ± S.E. (n = 10). *p < 0.05, **p < 0.01 compared with the WT control group; #p < 0.05, ##p < 0.01 compared with the APP/PS1 group.

