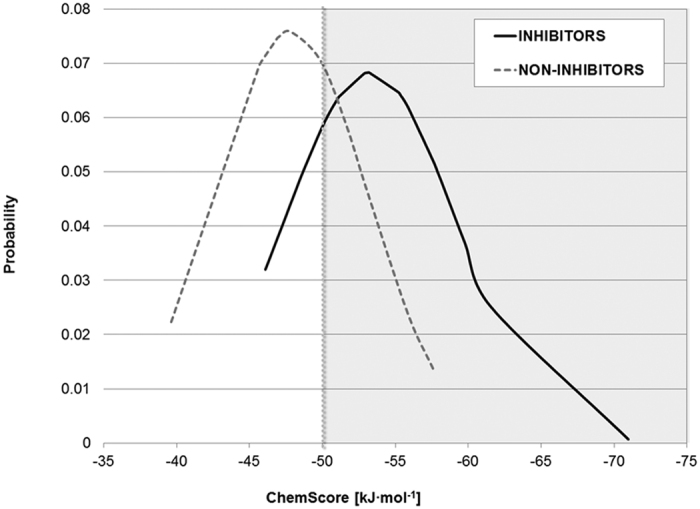
Figure 5. ChemScore distribution for a set of known inhibitors (black, solid line) and non-inhibitors (grey, dashed line).

An enrichment of inhibitors starts with ChemScore values < −50 kJ·mol−1 (highlighted grey area).

An enrichment of inhibitors starts with ChemScore values < −50 kJ·mol−1 (highlighted grey area).