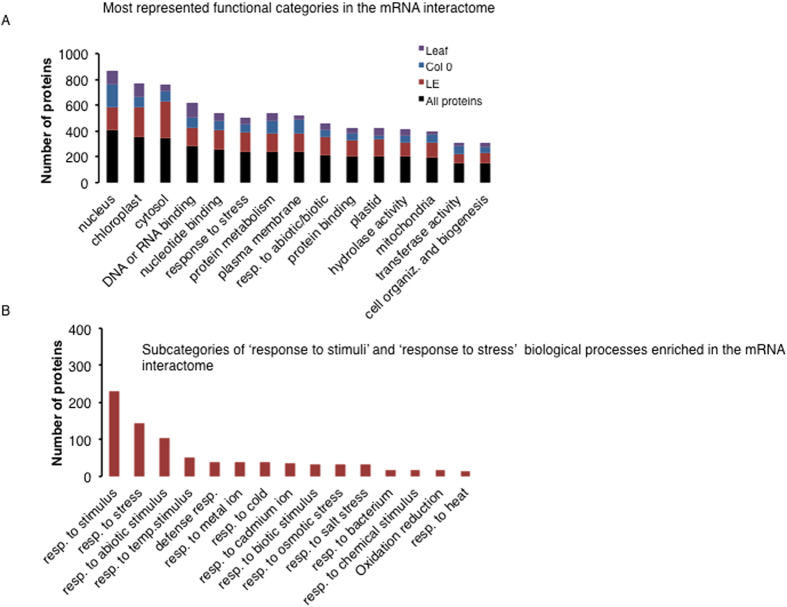
Figure 3. Gene ontology enriched terms in the mRNA interactome proteins.
(A) Number of proteins in each biological process category. In all categories the mRNA interactome proteins were analyzed (maroon bars), and proteins only unique to Col 0 (blue bars), Ler-0 (green bars) and leaf (purple bars) were also analyzed and their distribution compared. (B) Number of proteins in the enriched biological process ‘response to stimuli’ and ‘response to stress’ were plotted and their subcategories included. These biological processes were the most represented categories.

