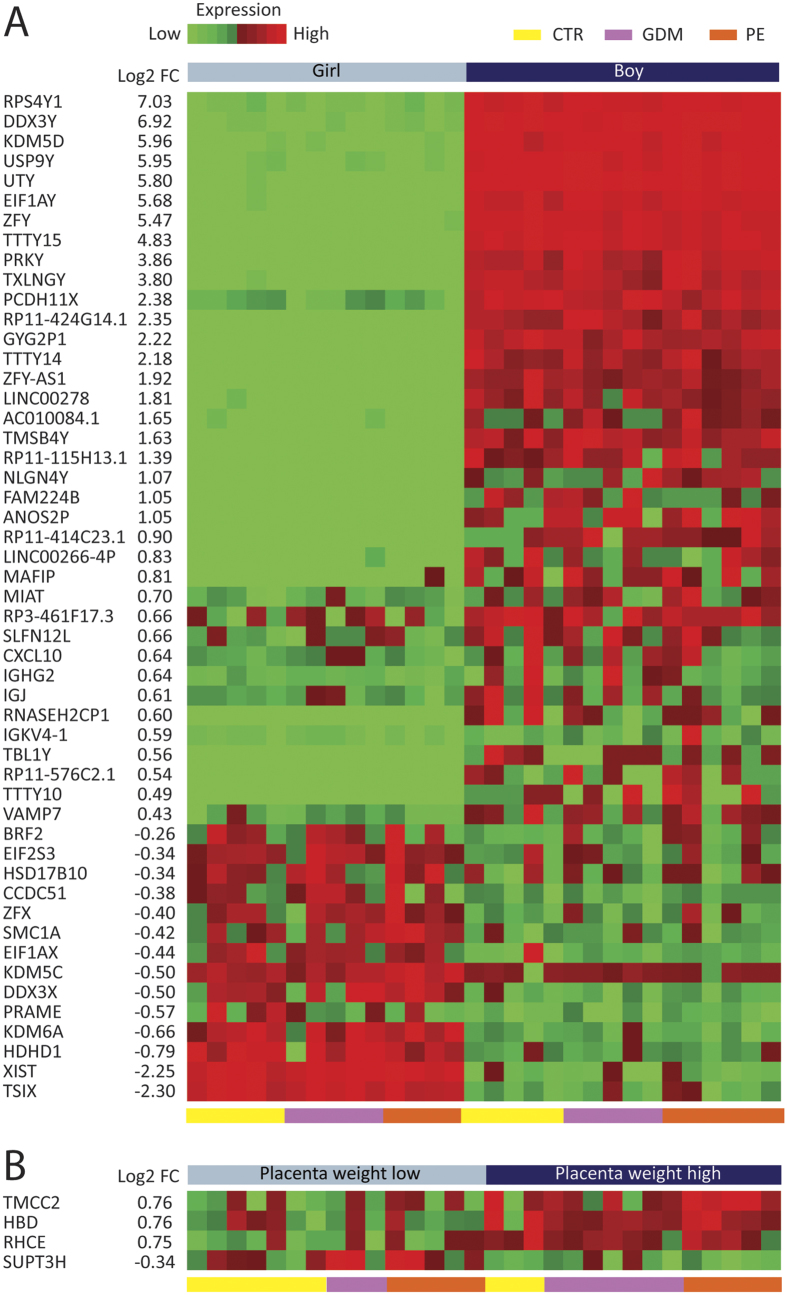
Figure 4. Effect of fetal variables on placental gene expression.
A heat map is shown demonstrating the effect of three fetal variables on placental DEGs: (A) Offspring sex (female vs. male), and (B) placenta weight (low-median vs. high) with FDR < 0.1. Heatmaps were constructed using log2 expression levels. The numbers to the left shows the log2 fold change value (log2FC) between groups. Samples are shown at the bottom of the figure, controls (yellow [CTR]), GDM (purple), and PE (red).

