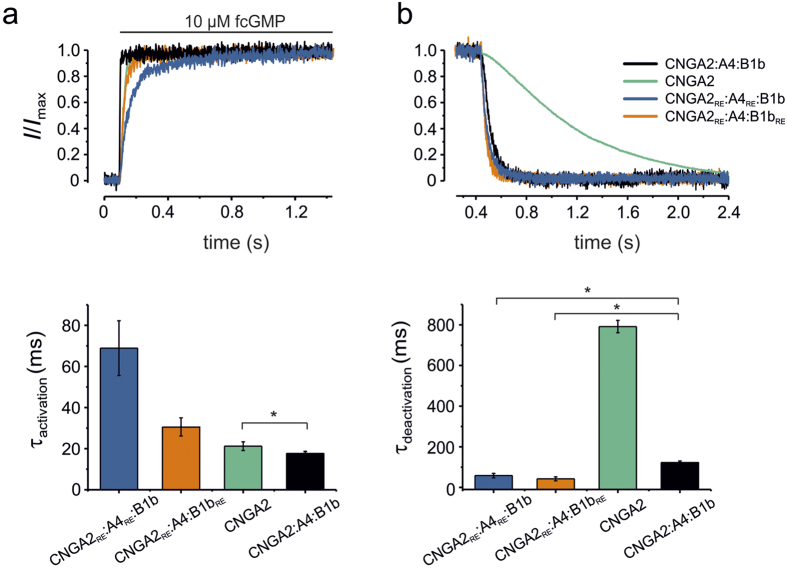
Figure 4. Effects of the CNGB1b and CNGA4 subunit on the kinetics of channel activation and deactivation.
Superimposition of activation (a) and deactivation (b) time courses following a concentration jump to 10 μM fcGMP and back to zero for CNGA2 (green), CNGA2:A4:B1b (black), CNGA2RE:A4RE:B1b (blue), and CNGA2RE:A4:B1bRE (orange) channels. The traces are averages obtained from 5–7 traces obtained from different patches. All traces were normalized with respect to the initial and late current (I/Imax). The voltage was set to +10 mV. The respective activation and deactivation time courses of the individual measurements were fitted with monoexponential functions apart from the activation of CNGA2RE:A4RE:B1b channels that required a biexponential function (Equation S1, Supplementary Information). The time constants are illustrated by bar graphs below the traces. For small differences a t-test with respect to CNGA2:A4:B1b channels was performed. An asterisk indicates a significant difference (p < 0.05).

