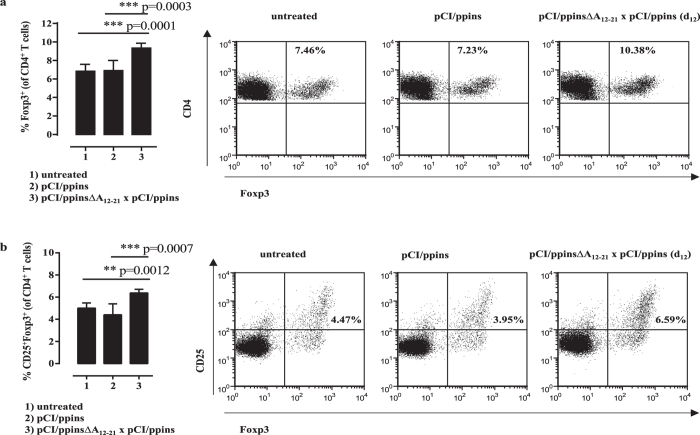
Figure 3. The ppins∆A12-21 vaccine induced Foxp3+ CD25+ Treg cells.
Splenic lymphocytes of untreated (group 1, n = 3), pCI/ppins-primed (group 2, n = 3) or ppins∆A12-21-vaccinated/ppins-primed (group 3, n = 3) PD-L1−/− mice were isolated 20 days after the injection of pCI/ppins, stained for surface CD4 and CD25 and intracellular Foxp3 expression and analysed by FCM. The actual percentage of Foxp3+ (a) and Foxp3+ CD25+ (b) Treg cells in gated CD4+ T cell populations ± SD of a representative experiment (out of two experiments performed) is shown (left panels). Statistically significant differences between the group 1 and group 3 or group 2 and group 3 were determined using the unpaired student’s t-test. P values of <0.05 (*), <0.01 (**) and <0.001 (***) were considered statistically significant. As example for the underlying flow cytometric analysis, Dot Plots from a representative mouse per group are shown (right panels).

