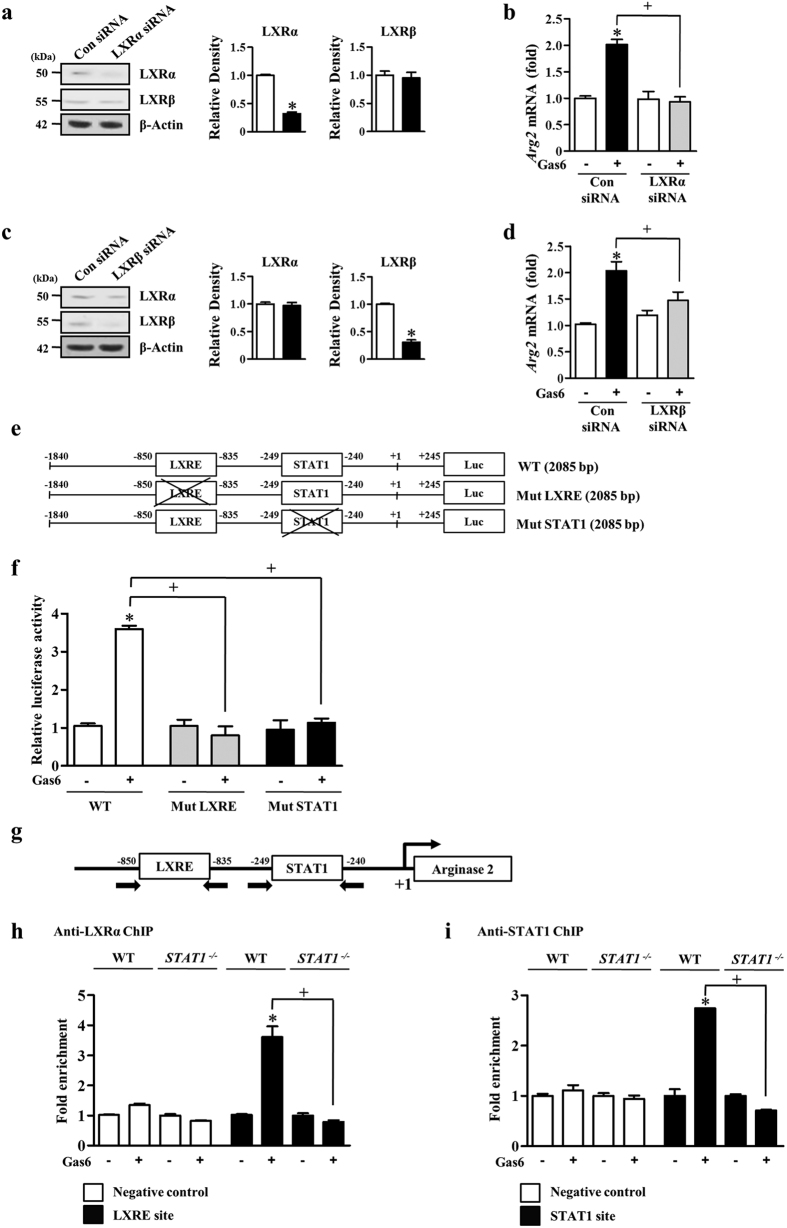
Figure 5. Gas6 increases Arg2 promoter activity through LXRE and STAT1 binding.
(a–d) RAW 264.7 cells were transfected with LXRα- or LXRβ-specific siRNA or negative control siRNA. After 24 h, the cells were treated with 400 ng/ml Gas6 for. (a,c) The relative abundances of LXRα and LXRβ proteins were determined by Western blotting analysis. Densitometric analysis of the relative abundances of the indicated proteins. (b,d) The relative abundance of Arg2 mRNA was determined by real-time PCR. (e,f) Site-directed mutagenesis of the Arg2 promoter. (e) Diagrams of the Arg2 promoter constructs (−1840 to +245; 2085 bp) with transcription factor binding sites represented by white boxes (LXRE site: −1108 to −1094; STAT1 site: −507 to −499; Luc, firefly luciferase). The crossed boxes denote the mutated sites. (f) Promoter reporter constructs were transfected into RAW 264.7 cells followed by treatment with or without Gas 6 (400 ng/ml) for 24 h. For each sample, firefly luciferase activity was normalized to Renilla luciferase activity. (g) Diagram of the Arg2 promoter region with putative transcription factor binding sites (LXRE: −1108 to −1094; STAT1: −507 to −499). Arrows indicate PCR primer binding sites. (h,i) Chromatin immunoprecipitation (ChIP) assays using anti-LXRα (h) and anti-STAT1 (i) antibodies were performed in BMDM from WT and STAT1−/− mice in the presence or absence of 400 ng/ml Gas6. A genomic locus around 4 kb upstream from the transcription start site of Arg2 was used to measure background binding. Data in all bar graphs are means ± SEM of three independent experiments. *P < 0.05 compared with control; +P < 0.05 as indicated.

