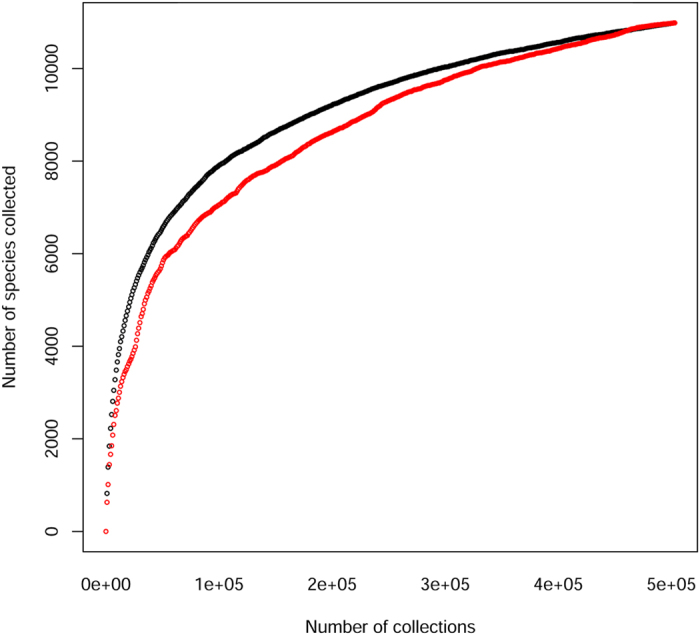
Figure 6. The number of species as a function of the number of collections.

Black line: data randomized with regard to year of collection. Red line: data in order of date collected.

Black line: data randomized with regard to year of collection. Red line: data in order of date collected.