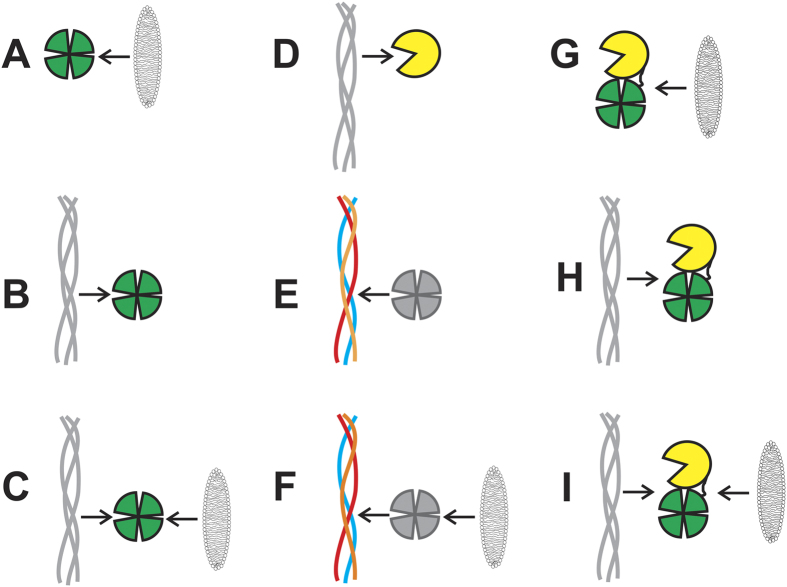
Figure 2. Interaction complexes examined by NMR spectroscopy.
(A) Labeled MT1-MMP HPX domain with bilayer mimics; (B) labeled MT1-MMP HPX domain with THP; (C) labeled MT1-MMP HPX domain with bilayer mimics and THP; (D) labeled MT1-MMP CAT domain with THP; (E) MT1-MMP HPX domain with labeled THP; (F) MT1-MMP HPX domain with bilayer mimics and labeled THP; (G) labeled sMT1-MMP with bilayer mimics; (H) labeled sMT1-MMP with THP; and (I) labeled sMT1-MMP with bilayer mimics and THP.

