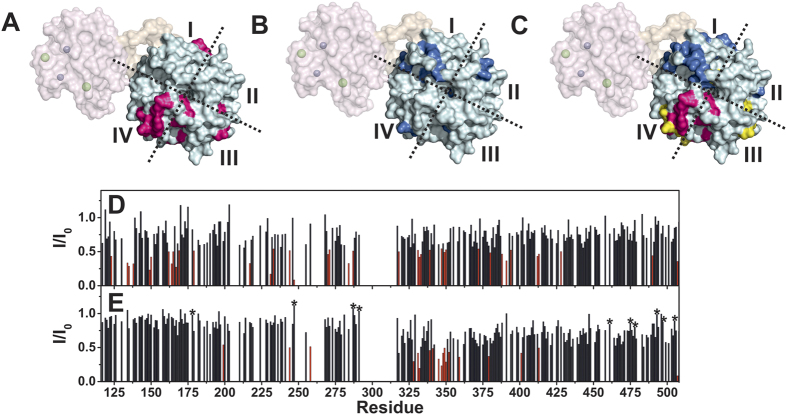
Figure 5.
Top: Surface representation of a homology model of sMT1-MMP with the residues of the HPX domain exhibiting the largest decrease in NMR signal intensity in the presence of (A) 2% w/v bicelles (in red), (B) THP (molar ratio sMT1-MMP:THP = 1:0.4) (in blue), or (C) 2% w/v bicelles and THP (molar ratio sMT1-MMP:THP = 1:2) (in red and blue, respectively). The residues affected by the binding to bicelles, whose signal intensity increases with the addition of THP, have been highlighted in yellow in panel C. Bottom: Intensity changes per residue of sMT1-MMP in the presence of THP (molar ratio sMT1-MMP:THP = 1:0.4) (D) and 2% w/v bicelles and THP (molar ratio sMT1-MMP:THP: = 1:2) (E). The residues exhibiting the largest decrease in signal intensity in the presence of THP (E123, K134, V135, Y138, R149, V150, V162, Y164, A165, I167, E169, I179, S217, N231, I233, A244, L247, V270, L271, G284, S287, I318, G331, E332, M333, R339, N347, V349, M350, Y372, V380, W388, D391, S394, T412, D413, Y428, K490, G507), and bicelles and THP (L199, A244, A258, M328, G331, E332, R339, F341, R345, N347, Q348, V349, M350, G352, Q359, F379, K401, D413, G469 and G507) have been highlighted in red. After the addition of bicelles some residues in the CAT domain and in blades III and IV of the HPX domain exhibited a decrease in signal intensity (I177, G211, A244, L247, A255, A258, G285, and K292 in the CAT domain and A327, Q359, K401, L406, W421, M422, Y435, L442, N452, K454, E461, R464, G469, D471, V473, T475, Y478, N487, Q489, K490, K492, E494, K499, and M506 in the HPX domain). The intensity of the signals belonging to sMT1-MMP before the addition of bicelles and THP was taken as reference (intensity = 1). The residues exhibiting an increase in signal intensity after the addition of THP in the presence of bicelles have been marked with a star.

