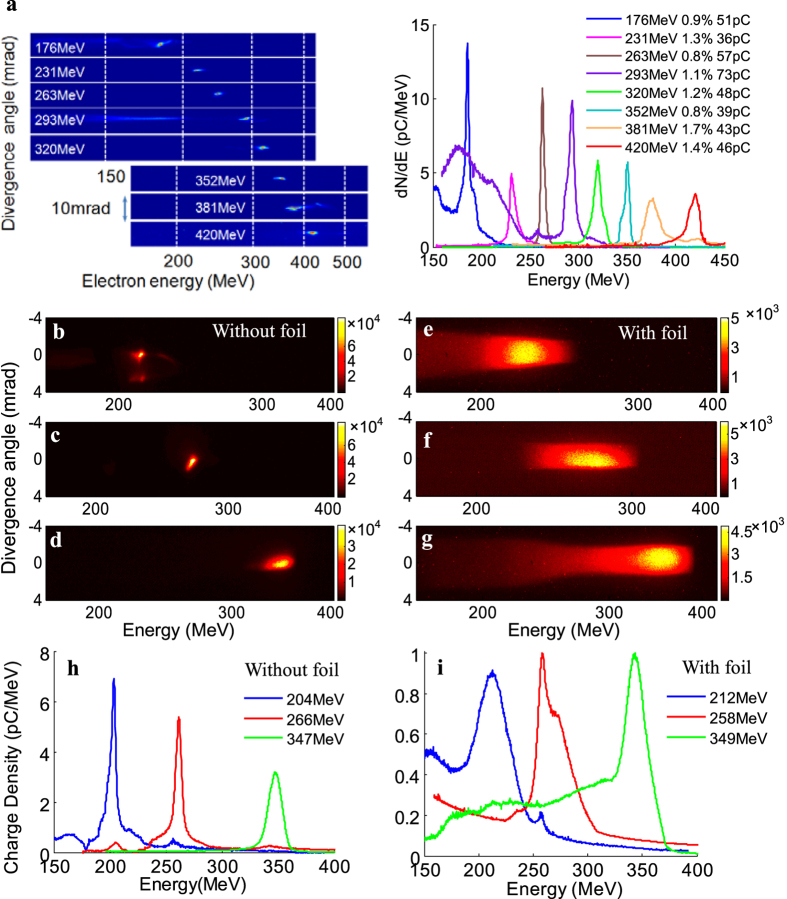
Figure 2. Measured electron spectra without and with the thin foil.
(a) Angle integrated energy spectra of tunable high-quality e-beams spectra with peak energies in the range of 160 to 420 MeV; (b–d) The peak energy, rms energy spread, integrated charge, and rms divergence of the three e-beams are: (b) 204 MeV, 1.2%, 52 pC, 0.29 mrad; (c) 266 MeV, 1.1%, 46 pC, 0.48 mrad; (d) 347 MeV, 1.7%, 45 pC, 0.43 mrad, respectively; (d–f) The corresponding spectra of the e-beams after penetrating the thin foil; (h,i) Spatially integrated electron spectra for the shots above.

