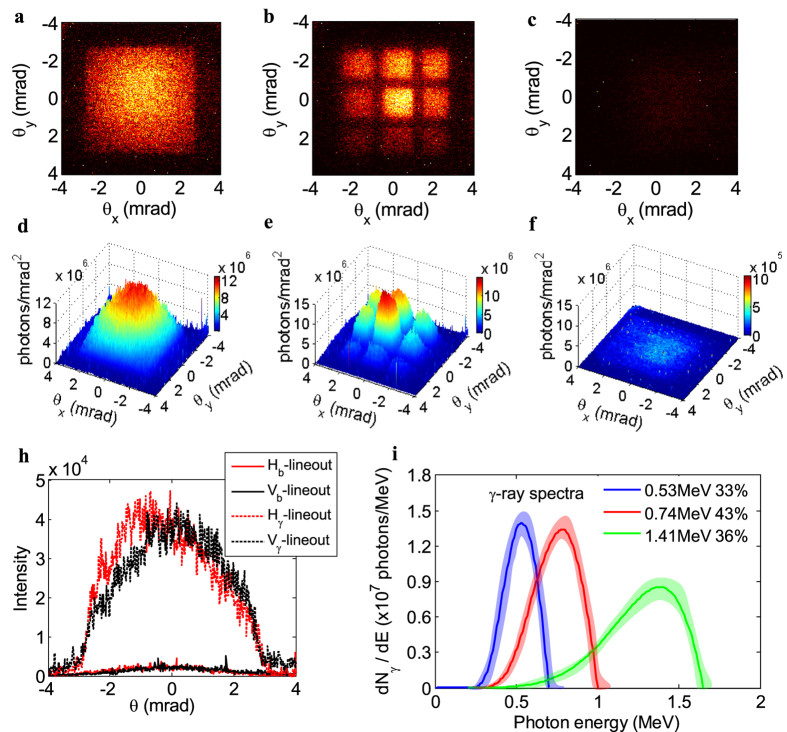
Figure 4. Raw data of γ-ray beam patterns and the reconstructed spectra.
(a) Typical background-subtracted Gaussian-profile γ-ray beam; (b) Imaged γ-ray beam profile transmitted through a 3 × 3 squared lead-grid filter, with the thickness of 1.5, 1, 0.5, 2.5, 0, 2, 5, 4, 3 mm respectively from upper left to low right; (c) Imaged background profile when the foil was placed at z = 10 mm; (d–f) Corresponding photons distribution on the detected system; (h) Horizontal and vertical lineouts of the γ-ray profile and the background profile; (i) Reconstructed γ-ray spectra under different e-beam energies in Fig. 2b–d, and the shaded bands represent the spectra uncertainties.

