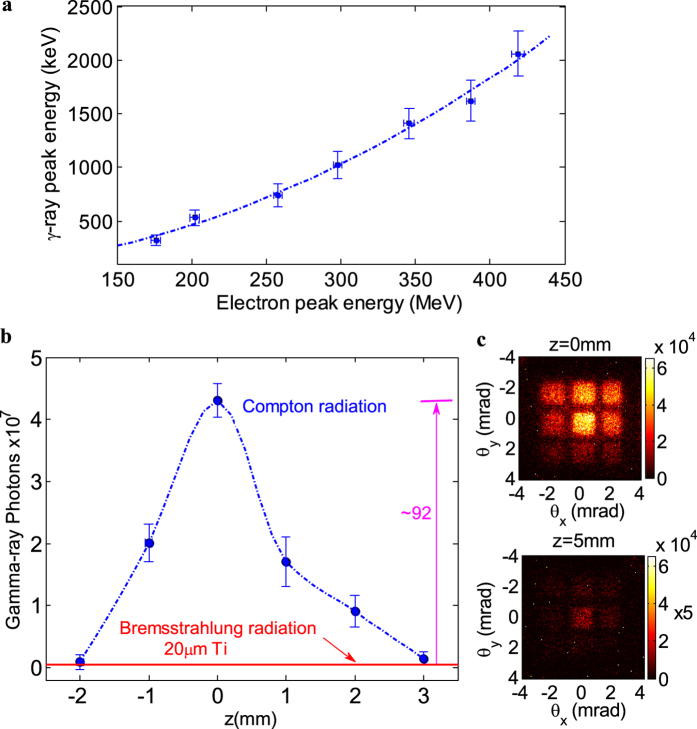
Figure 5. Measured γ-ray energy tuning and detected γ-ray photons as a function of the foil position.
(a) The measured γ-ray peak energy (each point for the single-shot data), plotted versus with the tunable e-beams peak energy, is fitted with the blue dash line, closed approximately to a 2γ2 scaling. The horizontal and vertical error bars correspond to the uncertainties of the e-beams and γ-rays peak energies, respectively; (b) Detected γ-ray photons as a function of the foil position. Each data point corresponds to an average over five consecutive shots at different z, and the error bars indicate the fluctuations of γ-ray yield. The bremsstrahlung background at z = 6 mm was plotted as the red line; (c) Raw γ-ray beam patterns with a nine-grid filter at z = 0 mm and z = 5 mm, respectively.

