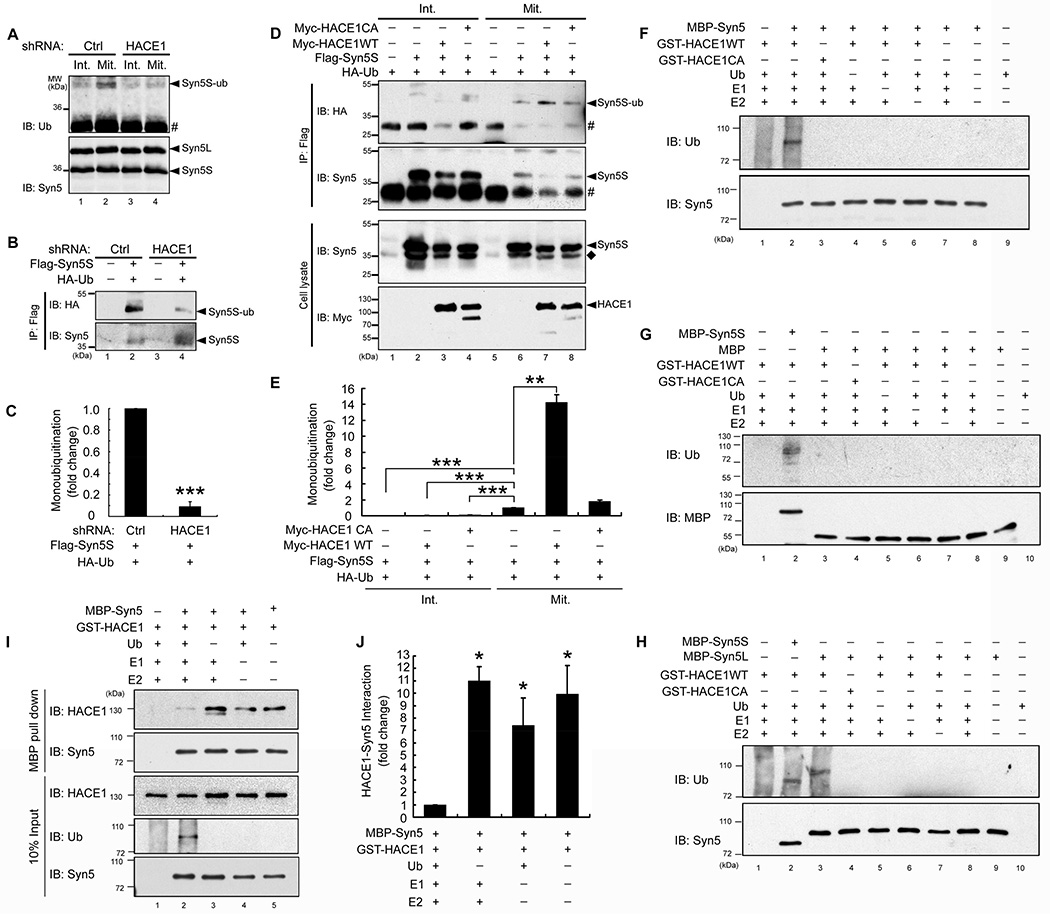
Figure 2. Monoubiquitination of Syn5 depends on HACE1.
(A) Endogenous Syn5 is ubiquitinated by HACE1 in mitotic cells. HeLa cells were infected by control (Ctrl) or HACE1 shRNA lentivirus to establish stable cell lines (Tang et al., 2011). Untreated interphase cells (Int.) or nocodazole-arrested mitotic cells (Mit.) were solubilized and immunoprecipitated with Syn5 antibodies followed by Western blotting for Syn5 and ubiquitin. Note that Syn5 was ubiquitinated in mitotic but not interphase cells (lanes 2 vs. 1), and depletion of HACE1 reduced Syn5 ubiquitination in mitosis (lanes 4 vs. 2). #, IgG light chain.
(B) HACE1 depletion decreases monoubiquitination of exogenously expressed Syn5 (Flag-Syn5S). Mitotic cells stably expressing Ctrl shRNA or HACE1 shRNA were transfected with indicated constructs and immunoprecipitated with a Flag antibody followed by Western blotting.
(C) Quantitation of (B) from three independent experiments.
(D) Co-expression of WT HACE1, but not the C876A mutant, increases mitotic Syn5 monoubiquitination. HeLa cells were transfected with indicated constructs. Interphase and mitotic cells were immunoprecipitated with a Flag antibody and analyzed by Western blotting. ◆, endogenous Syn5S; #, IgG light chain.
(E) Quantitation of (D) from three independent experiments.
(F–G) HACE1 directly ubiquitinates Syn5 in vitro. Indicated proteins were mixed and incubated, followed by Western blotting for ubiquitin and Syn5. Note the ubiquitin signal on MBP-Syn5 but not MBP.
(H) Both short and long forms of Syn5 are ubiquitinated in vitro.
(I) Ubiquitination reduces Syn5 interaction with HACE1. MBP-Syn5 was re-isolated after the in vitro ubiquitination assay and bound proteins were assessed by Western blot. Note the increased ubiquitin signal and reduced HACE1 in lane 2.
(J) Quantitation of (I) from three independent experiments.
Data are represented as mean ± s.e.m. Statistical significance was assessed by student’s t-test. *, p < 0.05; **, p < 0.01; ***, p < 0.001.
See also Figure S2.

