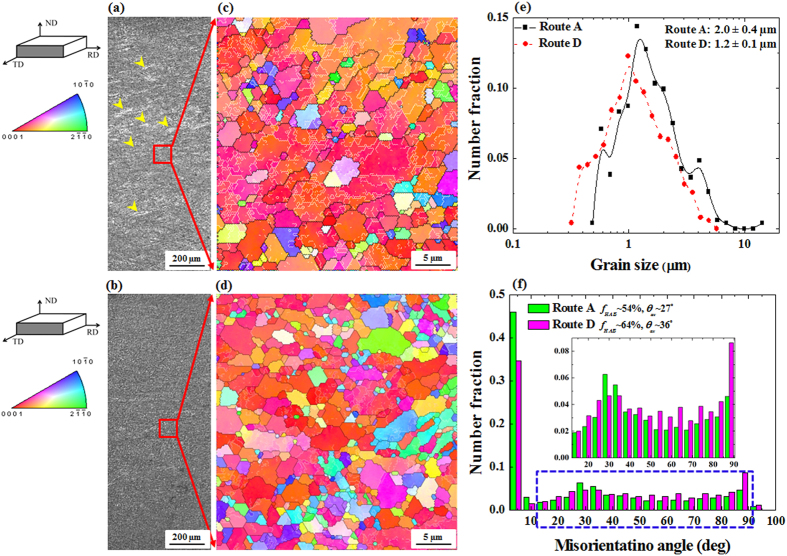
Figure 2.
Optical micrographs showing the microstructure of the DSR-deformed AZ31 alloy samples using route A (a) and route D (b). Inverse pole figure (IPF) maps showing the microstructure of the DSR-deformed AZ31 alloy samples using route A (c) and route D (d) (white lines indicate the low angle boundaries (<15°)). Grain size distributions of the DSR-deformed AZ31 alloy samples (e) (Grain size distributions were obtained based on a tolerance angle of 5°). Boundaries misorientation distributions of the DSR-deformed AZ31 alloy samples showing the fraction of the high angle boundaries (fHABs) and the average misorientation angle (θav) (f).

