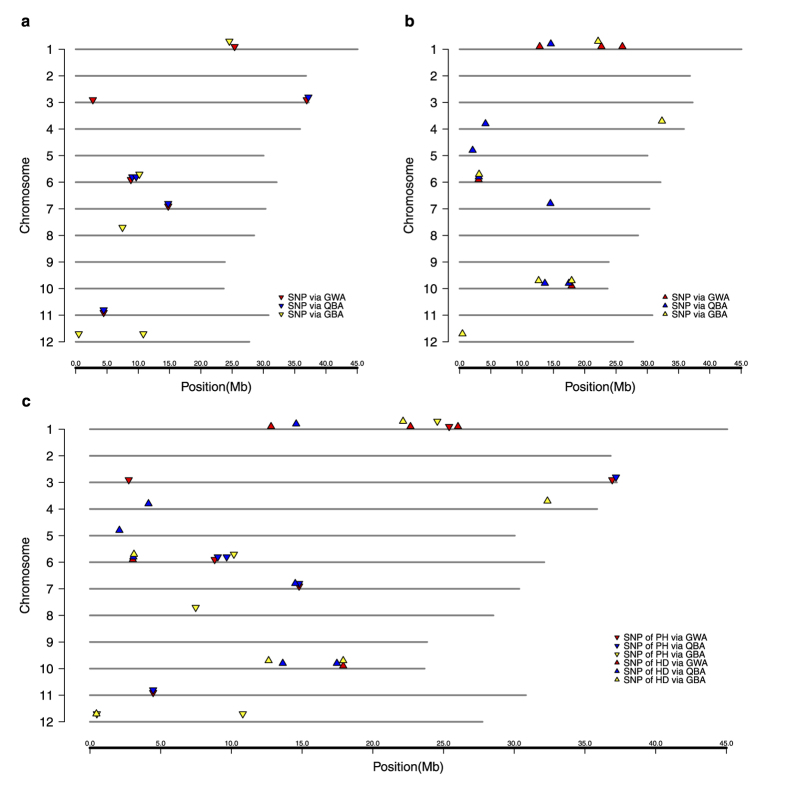
Figure 2. The genomic distribution of detected QTSs for the PH and the HD.
(a) Genomic positions of detected significant QTSs associated with the plant height through three strategies: Red, genome-wide association strategy (GWA); Blue, QTL-based association strategy (QBA); Yellow, gene-based association strategy (GBA). (b) Genomic positions of detected significant QTSs associated with the heading date through three strategies. (c) Genomic positions of detected significant QTSs associated with the plant height (Inverted triangle) and the heading date (triangle) through three strategies.

