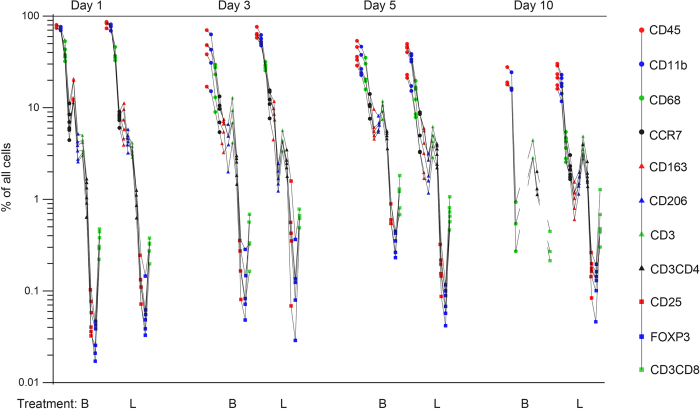
Figure 1. Inflammatory signature of tendon healing day 1, 3, 5 and 10, with and without reduced loading by Botox.
Note change in pattern over time. Each line describes cell counts from one rat. The Y-axis presents data on a log scale. All markers are expressed as percent of all cells. Full loading is indicated by L, and Botox by B. The points on the line represents the immune cell markers in the following order: CD45 (leukocytes), CD11b (phagocytes), CD68 (pan-macrophages), CCR7, CD163, CD206 (macrophage subtypes), CD3, CD4, CD25, Foxp3, CD8a (lymphocytes and lymphocyte subtypes). On day 10 several markers were below detection level in the Botox group, hence the interrupted lines. N = 6 for most groups, with exceptions, see text.

