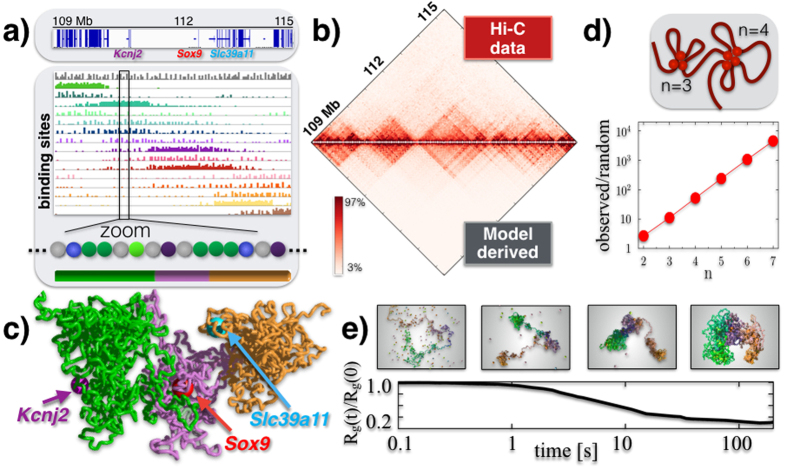
Figure 4. Polymer physics captures the folding of the Sox9 locus.
(a) Top: the considered Sox9 locus in mESC-J1 cells, with a few marker genes. Bottom: the SBS polymer model that best explain the Hi-C contact map of the Sox9 region has the shown different types of binding sites, as seen in the zoom (different colors); their abundance is represented as an histogram over the genomic sequence. The bar at the bottom highlights three main regional areas to help 3D visualization. (b) The model derived pairwise contact frequency matrix (bottom) has a 95% Pearson correlation with Hi-C experimental data (top). (c) A snapshot of the Sox9 locus in its closed disordered state as derived by the polymer model, with the position of TSSs of some key genes highlighted. (d) In the locus, many-body contacts of n sites are exponentially more abundant than in random SAW conformations (the ratio of the average number is plotted v.s. n), which could help the simultaneous co-localization of multiple functional regulatory regions. (e) The Sox9 locus folding dynamics from an initially open conformation towards the closed disordered state is represented by the gyration radius, Rg(t). Chromatin domains self-assemble hierarchically in higher-order structures, in approx. 20s.

