
Figure 1. Longitudinal evaluation of gene marking in blood cells after gene therapy.
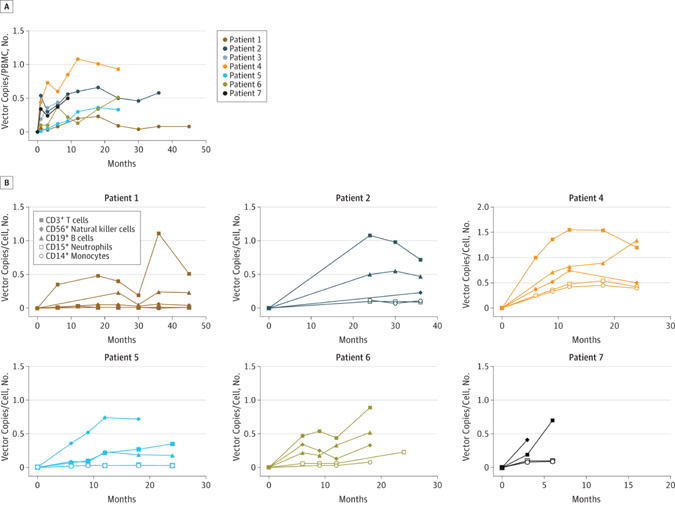
(A). Gene marking in peripheral blood cells over time after gene therapy in patients P1 to P7, as expressed by vector copy numbers per cell (VCN) in PBMC and measured by q-PCR. (B). Gene marking in various blood cell subsets in each patient, expressed as VCN in: CD3+ T cells (filled squares); CD56+ NK cells (filled diamonds); CD19+ B cells (filled triangles); CD15+ neutrophils (open squares) and CD14+ monocytes (open circles).