
Figure 2. Lymphoid engraftment and expression of the WASp transgene measured by flow cytometry.
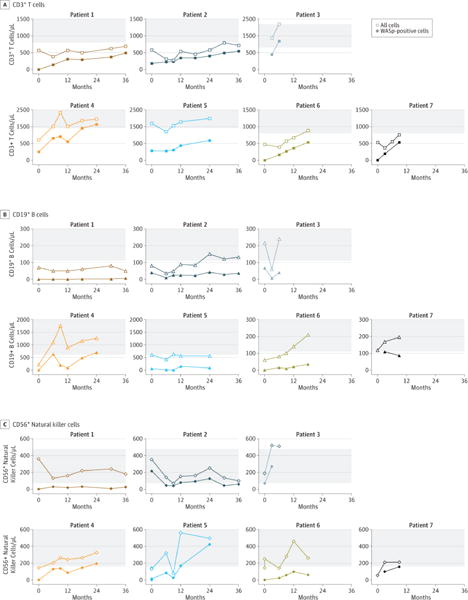
(A) Time course of lymphoid cell subsets recovery in blood after gene therapy: The total (open symbols) or WASp+ (filled symbols) levels of CD3+ T cells (squares), CD19+ B cells (triangles) and CD56+ NK cells (diamonds) were measured in blood over time. Tinted areas indicate values in aged-matched individuals. (B) WASp expression in lymphoid cell subpopulations at different times after gene therapy: Expression of WASp using specific antibodies is indicated by a thick line in CD3+ T lymphocytes, CD19+ B lymphocytes, CD56+ NK cells and CD4+ CD25+ FoxP3+ regulatory T cells (Tregs). Control antibody staining is shown by a gray overlay. WASp marking in T, B and NK cells of P1 to P7 performed respectively at months 30, 30, 6, 24, 24, 12 were shown. WASp marking in Tregs of P2, P4, P5 were performed respectively at months 30, 18, 18.