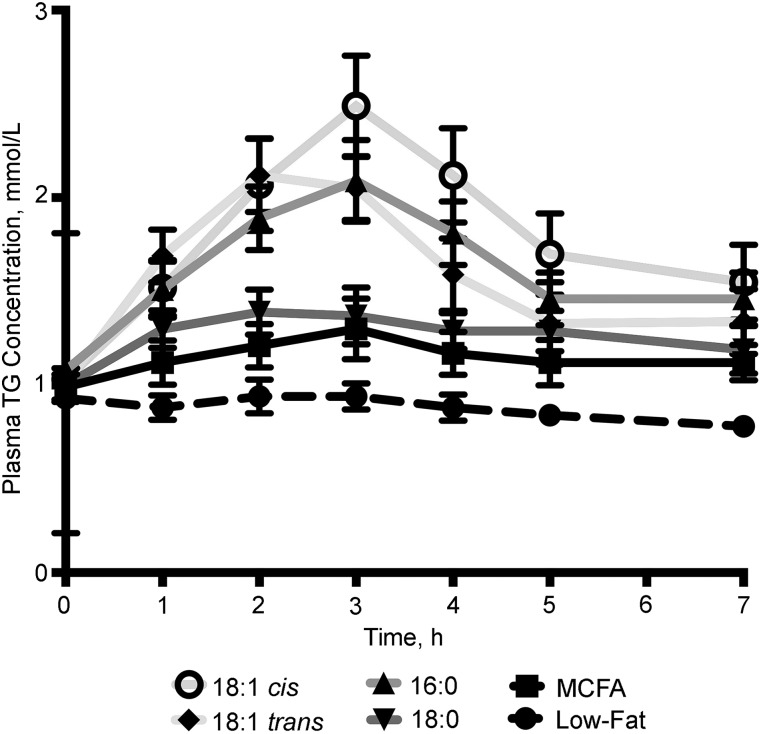
FIGURE 2.
Postprandial changes in plasma TG concentrations after consumption of 6 different test meals. In total, 11 healthy men and 5 healthy women consumed, in random order, a low-fat meal and 5 different high-fat meals (90 g) rich in MCFAs, palmitate (16:0), stearate (18:0), elaidate (18:1 trans), or oleate (18:1 cis). Values are given as means ± SEMs. MCFA, medium-chain FA. Data are from reference 51.

