
FIGURE 2.
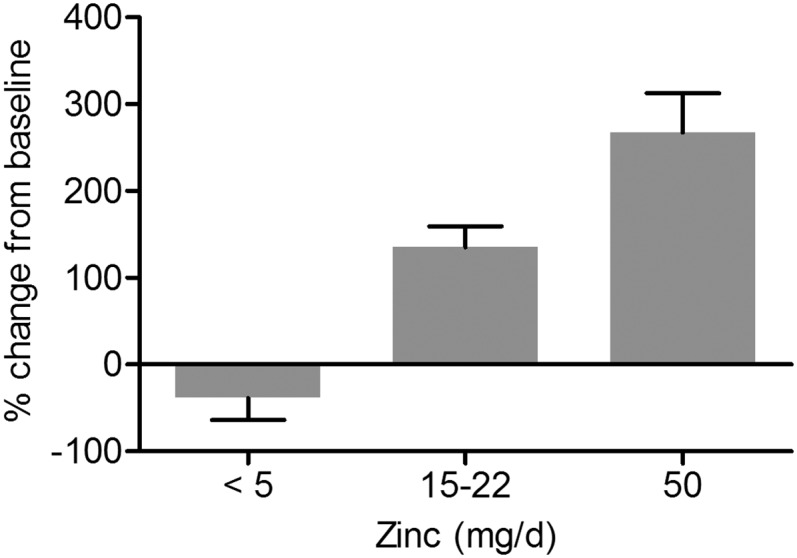
Metallothionein expression in leukocytes. Values are percentage changes from baseline ± SEs for all studies that examined metallothionein expression in leukocytes. In studies that determined metallothionein expression at multiple time points (19–21), the day with the greatest percentage change was used. Data are grouped based on the amount of dietary zinc consumed per day [<5 mg Zn/d, n = 2 (23, 31); 15–22 mg Zn/d, n = 7 (19, 20, 26, 27, 33); 50 mg Zn/d, n = 2 (21, 34)].