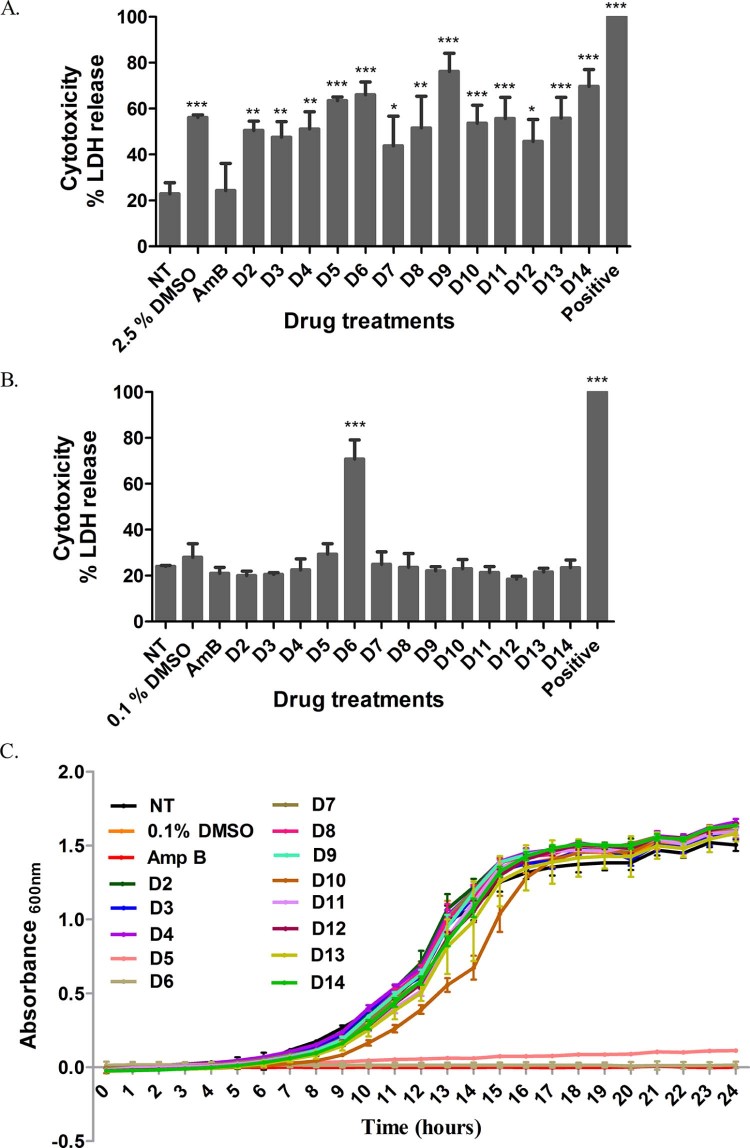
Fig. 3.
Effect of drug treatments on host cell cytotoxicity and fungal growth inhibition. (A,B) Lactate dehydrogenase (LDH) released from murine macrophages was measured after 18 h of drug treatment with 10 µM drugs (2.5% DMSO) (A) and 5 µM drugs (0.1% DMSO) (B), and 1.25 µg/mL AmB. 0.1% Triton X-100 was used as a positive control. Values represent the mean ± standard deviation (S.D.) from three independent experiments (one-way ANOVA + Dunnett's post-test, *P < 0.05, **P < 0.01 and ***P < 0.001). (C) Effect of 5 µΜ drugs (0.1% DMSO) on growth kinetics of H99-GFP cells. AmB (1.25 µg/mL) was used as a positive control. The growth curve shown is representative of three independent experiments. Values represent mean ± S.D. DMSO, dimethyl sulphoxide; NT, untreated cells.

