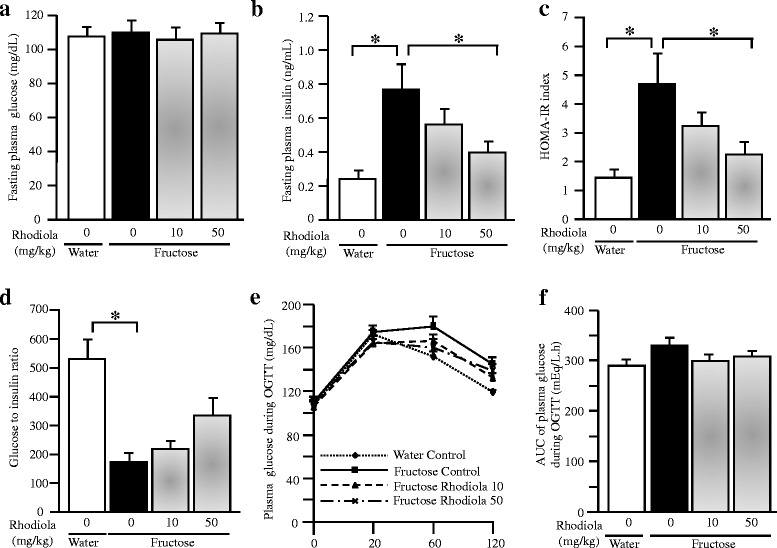
Fig. 3.

Plasma glucose (a) and insulin (b) concentrations under fasting condition, HOMA-IR index (c), the ratio of glucose to insulin (d), plasma glucose concentrations and the AUC of plasma glucose concentrations (e and f) during OGTT in rats. The fructose controls (Rhodiola 0 mg/kg) and fructose Rhodiola (50 mg/kg) group had free access to 10 % fructose in their drinking water over 18 weeks. The water controls (Rhodiola 0 mg/kg) had free access to a tap water. Rhodiola (50 mg/kg) was administered by gavage daily during the last 5 weeks. The water and fructose controls received vehicle (5 % Gum Arabic) alone. Data are means ± SEM (n = 6-9 each group). * P < 0.05
