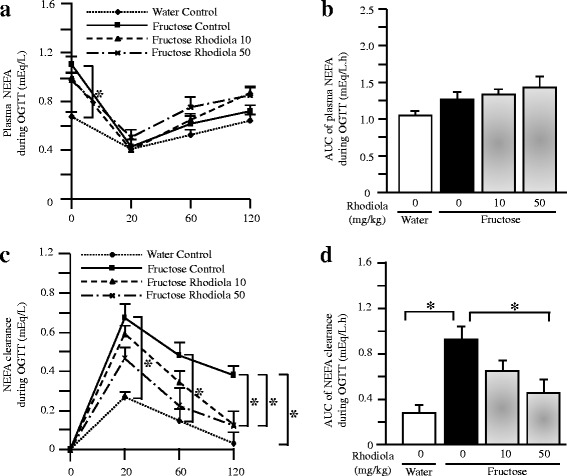
Fig. 5.

Plasma NEFA concentrations (a), the AUC of plasma NEFA concentrations (b), plasma NEFA clearance (c), and the AUC of plasma NEFA clearance (d) during OGTT in rats. The fructose controls (Rhodiola 0 mg/kg) and fructose Rhodiola (50 mg/kg) group had free access to 10 % fructose in their drinking water over 18 weeks. The water controls (Rhodiola 0 mg/kg) had free access to a tap water. Rhodiola (50 mg/kg) was administered by gavage daily during the last 5 weeks. The water and fructose controls received vehicle (5 % Gum Arabic) alone. Data are means ± SEM (n = 6-9 each group). * P < 0.05
