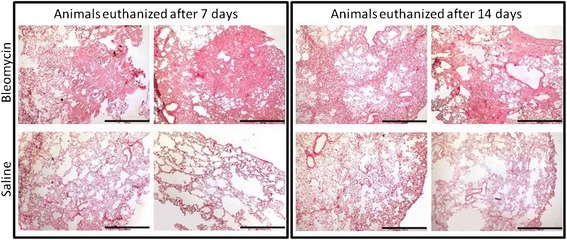
Fig. 4.

Representative pictures of Sirius Red staining performed on lung tissue from saline control and BLM treated animals. The left section is slides from animals euthanized 7 days after last BLM or saline dose, while the right section is slides from animals euthanized 14 days after last BLM or saline dose. Slides from BML treated animals are depicted in the upper row, while slides from saline treated animals are depicted in the lower row. Pictures were taken at 4x magnification, and the black scale bar in the lower right corner of each picture indicates 1000 μm
