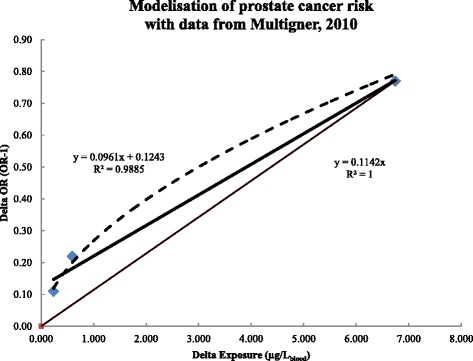
Fig. 1.

Linear regression for the ERF from three exposure groups in the KARUPROSTE study. ERFs calculated with equation 1 for each exposure group in the KARUPROSTATE study are plotted as squares. Dashed line is the “best” regression (best R2) between delta exposure and delta risk (Power function: y = 0.2685x0.5664, R2 = 0.9919). The thick line is the linear regression (equation and R2 values shown to the left). The thin line is the graphical representation of the final ERF (equation and R2 values shown to the right) derived from the first exposure group that significantly differs from the reference group, i.e. the highest exposed group
