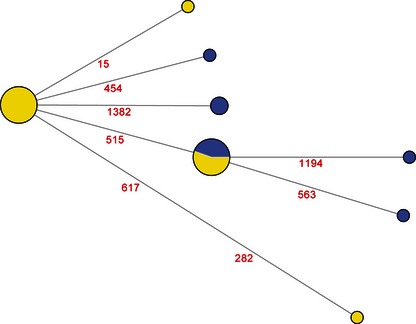
Figure 1.

Network analysis of the different alleles identified among all samples. Each circle represents a different allele, and its size is proportional to the number of sequences by allele identified (total number of sequences included in the analysis = 25). Yellow and blue indicate the sequences from the NAIVE and PASSIV‐VAC groups, respectively. The numbers indicate the position were nucleotide differences were identified.
