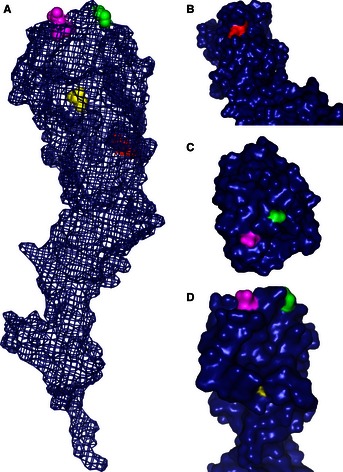
Figure 2.

Protein model for one HA1 monomer of A/Swine/IA/00239/04 (challenge virus). (A) Mesh model highlighting the spatial distribution within the protein of the amino acids that were found different. Close ups B, C, and D represent the predicted surface of the protein and the area exposed for each amino acid replaced. NAIVE: Q189P (magenta) within antigenic site B; PASSIV‐VAC: K171R (red) within antigenic site D; and A135P (yellow) within antigenic site A. The green spheres represent G155E that was seen in both groups NAIVE and PASSIV‐VAC within the antigenic site D.
