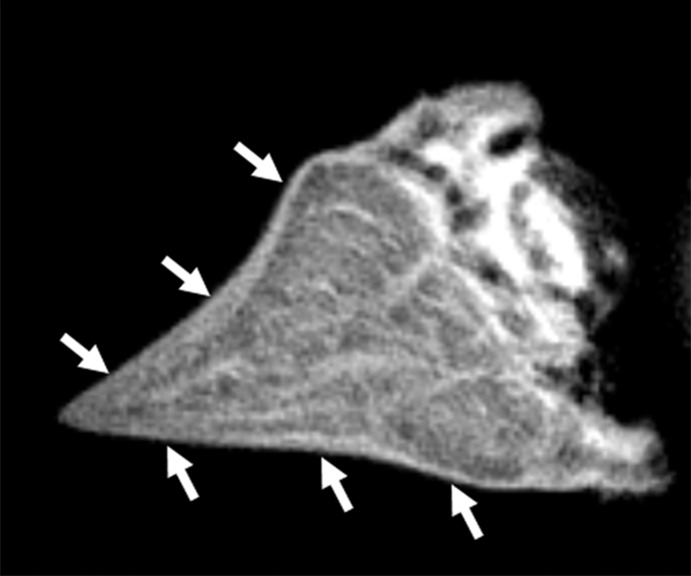
Figure 3a:
Representative UTE MR images of (a) normal lamellar layer and (b) abnormally thick one and corresponding graphic relationship between the lamellar layer thickness and indentation stiffness in (c) normal lamellar layer and (d) an abnormally thick one, respectively. (a) MR image (TR msec/TE μsec , 300/10): Normal lamellar layers (arrows) are seen as crescent-shaped hyperintense lines with smooth tapering. (b) MR image (TR msec/TR msec, 300/12): Abnormally thick lamellar layer on the femoral surface shows marked thickening of the layer with loss of normal tapering (solid arrows). Note the normal thin linear lamellar layer on the tibial surface (open arrows). (c) Normal lamellar layer shows highly positive correlation between lamellar layer thickness and indentation peak force with one-to-one correlation at each site on femoral surface. (d) Abnormally thick lamellar layer reveals highly negative correlation between lamellar layer thickness and indentation peak force. CC = correlation coefficient.

