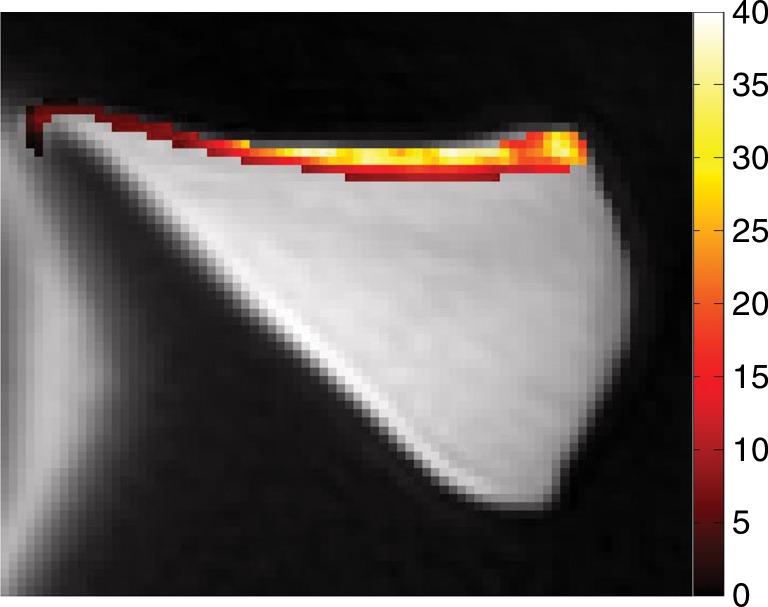
Figure 4f:
Representative MR images show meniscus with (a–d) normal lamellar layer and with (e–g) abnormally thick lamellar layer. (a) Placement of region of interest by freehand drawing. Corresponding spin-echo T2 (in milliseconds) (b, e), UTE T2* (in milliseconds) (c, f), and UTE T1ρ (in milliseconds) (d, g) overlay color maps apparently demonstrate differences in the lamellar layer matrix between the two groups. The spin-echo T2, UTE T2*, and UTE T1ρ values are generally higher in the abnormal surfaces compared with the values in the normal surfaces.

