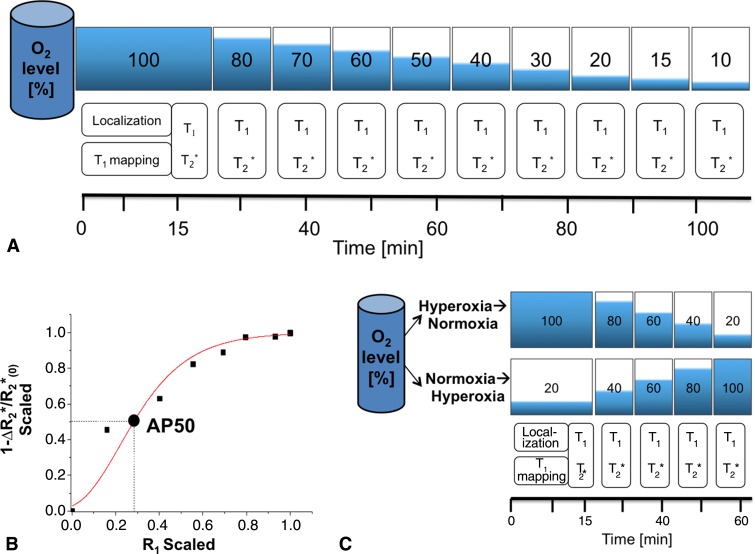
Figure 2:
Illustrations and graph show MR imaging analysis of apparent hemoglobin dissociation (AP50). A, Pregnant mice were analyzed by using hyperoxia-to-hypoxia respiration challenge with gradual decrease in fractional inhaled oxygen level from 100% to 10%. T1 mapping was performed at the initial phase, three-dimensional gradient-echo T2*-weighted and T1-weighted images were acquired sequentially at each oxygen phase. Each phase was maintained for approximately 8 minutes, resulting in approximately 100 minutes of total imaging time per mouse. B, Example of MR imaging-based oxygen hemoglobin dissociation curve (squares and circle) fitted to Hill function (red line) to extract MR imaging–based AP50 value. C, Illustration shows minimal configuration for mapping AP50. Hyperoxia-to-hypoxia data were reanalyzed with subset of inhaled oxygen phases, excluding hypoxic period (hyperoxia-to-normoxia), and an additional experiment was performed by using a normoxia-to-hyperoxia respiration challenge.

