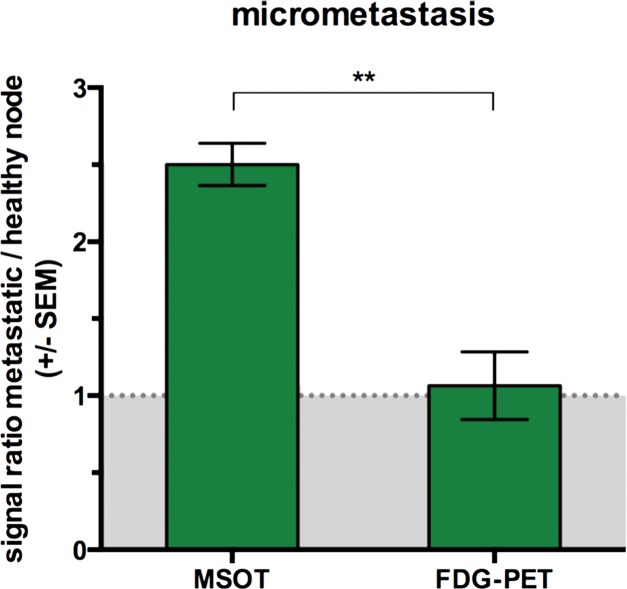
Figure 2d:
Detection of macro- versus micrometastasis. (a) MSOT and FDG PET/CT images and photomicrographs (H-E stain) in mouse (representative of four mice) bearing melanoma macrometastasis in right popliteal lymph node (red dashed circles; arrowheads in coronal maximum intensity projection [cor MIP] view). (b) Bar chart shows difference in metastatic-to–healthy contralateral popliteal node signal ratio between MSOT and FDG PET in macrometastases. SEM = standard error of the mean. (c) MSOT and FDG PET/CT images and photomicrographs (H-E stain) in mouse (representative of six mice) with node being infiltrated by micrometastasis (green dashed circles; green arrowheads in coronal maximum intensity projection [cor MIP] view) 3–4 weeks after primary tumor inoculation in right foot. Although MSOT and FDG PET/CT were both able to depict hemorrhagic melanoma macrometastasis in a and b), only MSOT signal unmixed for melanin (yellow) could help detect micrometastatic infiltration of melanoma cells in cortex of popliteal node. Magnified MSOT views of nodal basins (large dashed circles) were subtracted from background (MSOT signal for melanin was thresholded from 8 to 50 au for optimized display). Bright MSOT melanin signal and FDG activity, respectively, present at caudal end of coronal maximum intensity projection images, represent primary tumor (Pt) in right hind paw. Nodal status was histologically confirmed on the basis of the typical appearance of melanin pigment at H-E staining (brown). Although only a small focus of lymphoid tissue was found to be left in hemorrhagic macrometastatic node (in a), micrometastatic infiltration was limited to cortex of node, with most regular follicular lymph tissue still being intact (in b). A = anterior, ax = axial, C = caudal, Fb = femur, R = right, Rc = rectum, Tv = tail vessels, Ut = urethra. Dashed white circles = contralateral popliteal healthy control node; MSOT images were unmixed for deoxygenated hemoglobin (blue), oxygenated hemoglobin (red), and melanin (yellow). FDG PET scale is in percentage ID per gram of tissue. (d) Bar chart shows difference in metastatic-to–healthy contralateral popliteal node signal ratio between MSOT and FDG PET in micrometastases. Signal ratio equal to or below 1 is not sufficient for metastasis detection (gray shaded area). SEM = standard error of the mean.

