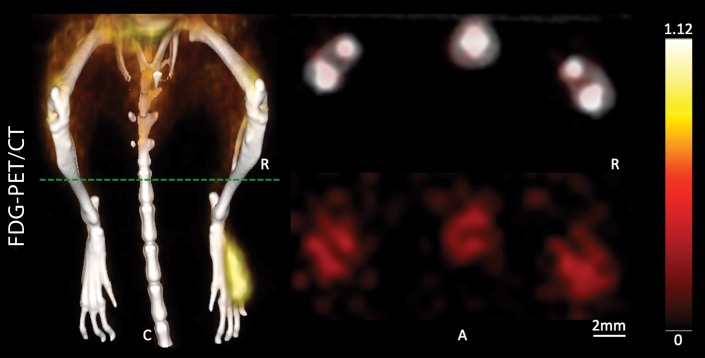
Figure 4c:
Detection of in-transit metastasis. (a) MSOT images show subtle melanin signal clusters of varying sizes (arrowheads) “in transit” from primary tumor site to lymph nodal basin (representative of four mice). A = anterior, C = caudal, R = right. Axial image plane is indicated by green dashed line on coronal maximum intensity projection (MIP) image. MSOT images are unmixed for deoxygenated hemoglobin (blue), oxygenated hemoglobin (red), and melanin (yellow). (b) Bar chart shows MSOT signal in in-transit metastasis and healthy contralateral control. SEM = standard error of the mean. (c) In contrast, FDG PET/CT could not reveal presence of in-transit melanoma metastases, as shown by corresponding FDG PET/CT images of same representative mouse. FDG PET scale is in percentage ID per gram of tissue. (d, f) Bar charts show FDG activity in in-transit metastasis (white bar) and healthy contralateral control node (gray bar) (d) and intermodality comparison of signal ratio in MSOT and FDG PET (f). Signal ratio equal to or below 1 is not sufficient for melanoma metastasis detection (gray shaded area in f). * = P < .05, ns = nonsignificant, SEM = standard error of the mean. (e) Photomicrographs (H-E stain) of respective tissue samples confirm presence of these metastasizing clusters of melanoma cells based on the typical brown pigment of melanin being surrounded by bone, muscle, vessels, and connective tissue.

