
Figure 6.
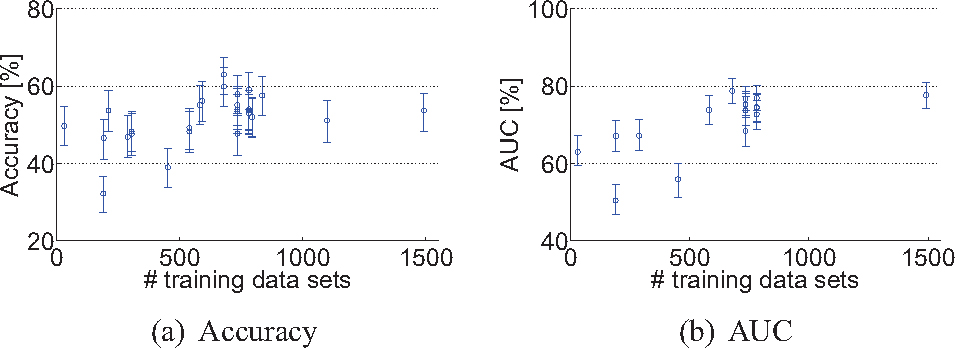
The number of training data sets used plotted against the test set performance of every algorithm: (a) Accuracy, (b) Area under the ROC-curve (AUC). The error bars show the 95% confidence interval.
Official websites use .gov
A
.gov website belongs to an official
government organization in the United States.
Secure .gov websites use HTTPS
A lock (
) or https:// means you've safely
connected to the .gov website. Share sensitive
information only on official, secure websites.
The number of training data sets used plotted against the test set performance of every algorithm: (a) Accuracy, (b) Area under the ROC-curve (AUC). The error bars show the 95% confidence interval.