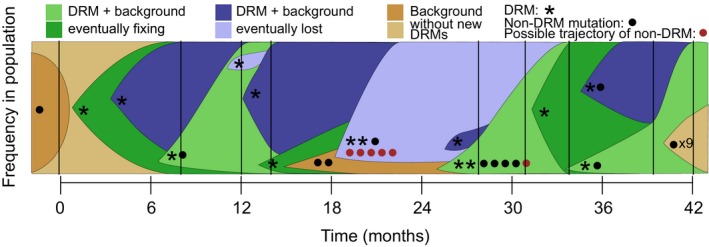
Figure 5.

Clonal interference in Mycobacterium tuberculosis. Dynamics of clonal interference among drug resistance mutations (stars) and mutations not known to be drug resistance mutations (dots) arising within a patient with tuberculosis. Each expanding colour block represents an M. tuberculosis lineage starting from one or more mutations and spreading through the population. Lineages are coloured depending on whether the mutations they possess ultimately fix in the population (green) or are lost (blue). Lineages that begin with mutations not known to be drug resistance mutations (non‐DRMs) are coloured in brown. The background on which each new lineage emerges is overlapped at the starting point of each colour block. Trajectories are inferred from allele frequencies at the point of sampling (black vertical lines). Mutations for which the inferred trajectories do not closely match clonal dynamics are marked in red. Data from Eldholm et al. (2014).
