Fig. 2.—
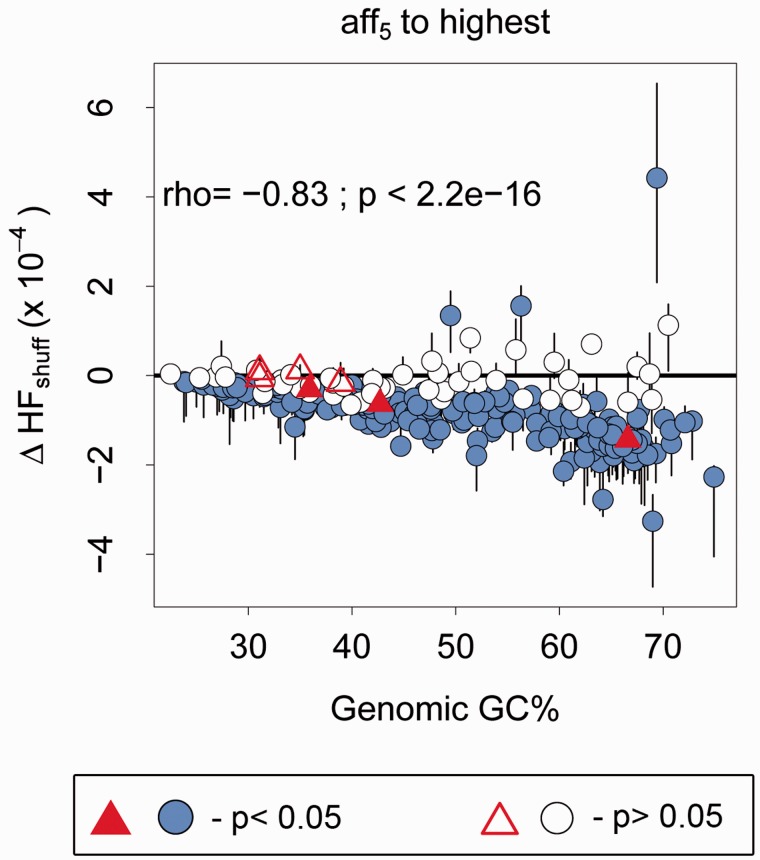
Median and interquartile range of corrected HF (ΔHFshuff = HFobs − HFexp) for hexamers as a function of genome GC%, in the highest affinity hexamer bin. The horizontal solid black line indicates no difference in observed and expected HF. Red triangles indicate organisms that do not use the SD mechanism. Colored circles and triangles indicate genomes for which HFobs is significantly different from HFexp. Spearman’s rho and P-value is given for the relationship between ΔHFshuff and genome GC%, for colored circles below 0.

