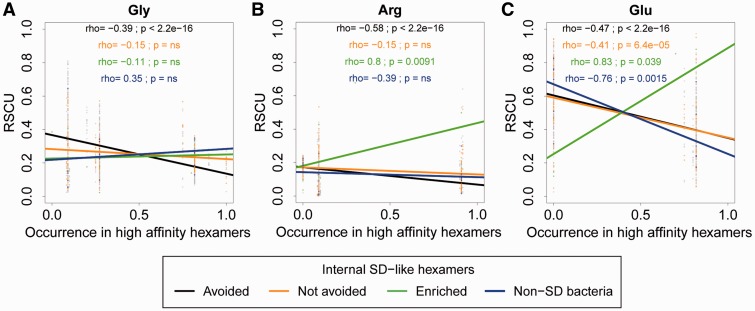
Fig. 4.—
RSCU of (A) Glycine, (B) Arginine, and (C) Glutamic acid codons as a function of the relative occurrence of the codon in SD-like hexamers (aff5 to highest). Black points and regression lines indicate genomes that avoid internal SD-like hexamers, orange points, and regression lines indicate genomes that do not avoid internal SD-like hexamers, green points, and regression lines indicate genomes that are enriched in internal SD-like hexamers (from fig. 2), and blue points and regression lines indicate genomes that do not use the SD mechanism of translation initiation. Spearman’s rho and significance values for each category are indicated in each panel in the same color. Slopes of the black and orange lines in the first two panels were significantly different from each other (Fisher’s z test for correlation coefficients, P < 0.01 in each case).

