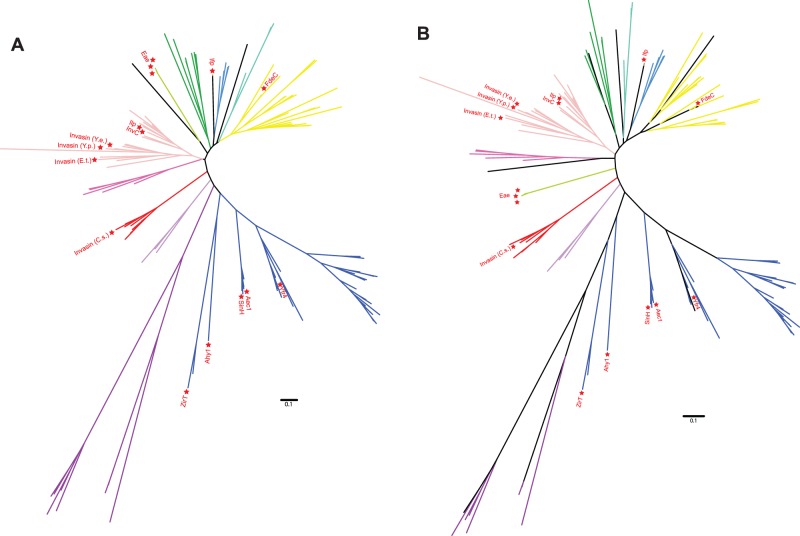
Fig. 4.—
Phylogenetic relationships of the major groups in the intimin/invasin superfamily as discussed in this study. (A) The unrooted representation of the tree in fig. 3 is shown, and the branches are colored according to the groups as assigned and shown as ring 3 in fig. 3. Functionally characterized proteins are indicated for additional orientation. This figure highlights the monophyly of some, but not all, groups as discussed in this study. (B) The same alignment was analyzed under a Bayesian algorithm (MrBayes, for details see the Methods section), not only highlighting the monophyly of the discussed groups but also showing the low confidence of the ordering of the deep branches.

