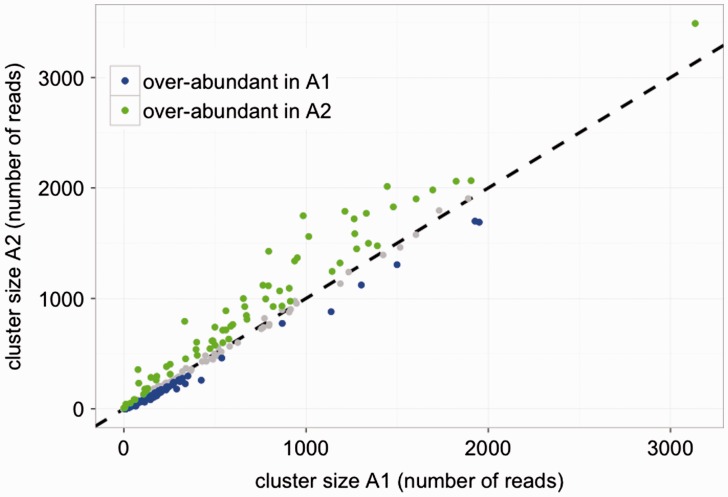
Fig. 3.
Scatter plot of cluster abundance in Gossypium herbaceum (A1) and Gossypium arboreum (A2). Clusters that exhibit statistically significant difference in abundance between the two species are color coded as indicated. Clusters that do not exhibit and statistical difference are indicated in gray.

