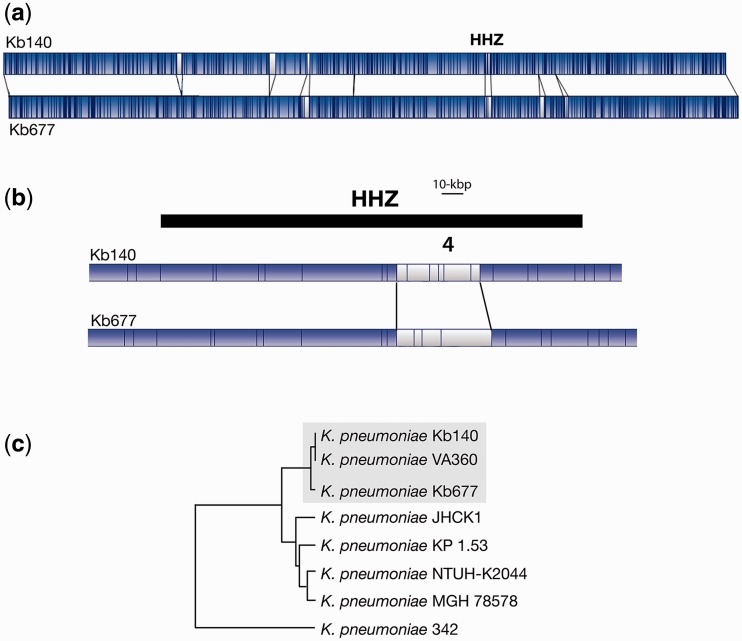
Fig. 1.—
Genomic comparisons. (a) The K. pneumoniae Kb140 and Kb677 whole genome maps were compared using the MapSolver 3.2.0 software. The blue and white regions represent matching and nonmatching DNA fragments, respectively. The location of the HHZ is indicated. (b) Zoom-in the HHZ region. (c) Map similarity cluster showing K. pneumoniae Kb140 and Kb677 in relation to other completely sequenced K. pneumoniae strains. Dendogram was generated using Unweighted Pair Group Method with Arithmetic Mean. The strains Kb140, Kb670, and the closely related VA360 are boxed.

