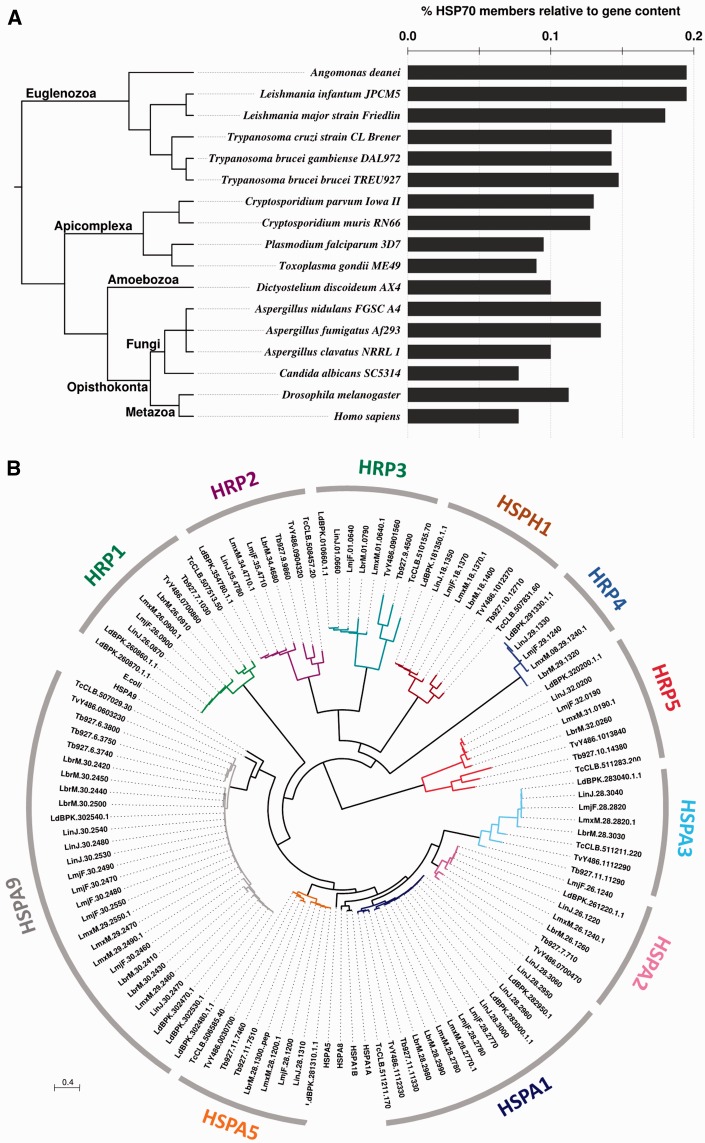
Fig. 3.—
Comparative analyses of the L. major HSP70 family. (A) HSP70 gene coding density. Number of HSP70 members relative to the genome size of selected eukaryotes is shown. The phylogenetic relationship (left) is freely derived from consensus knowledge on eukaryote systematics (Adl et al. 2012; He et al. 2014; Williams 2014). (B) Unrooted ML phylogenetic tree of the TriTryp HSP70 family. E. coli DnaK (acc. no. WP_000516138.1), human HSPA9 (AAH24034.1), HSP1A1A (AAH18740.1), HSPA1B (EAX03529.1), HSPA5 (AAI12964.1), and HSPA8 (AAH07276.2) were included to identify the cluster of potential mitochondrial, cytoplasmic, or ER HSP70 family members. The different colors correspond to different phylogenetic clusters that are labeled according to table 1. Scale bar represents 0.4 amino acid substitutions per site.

