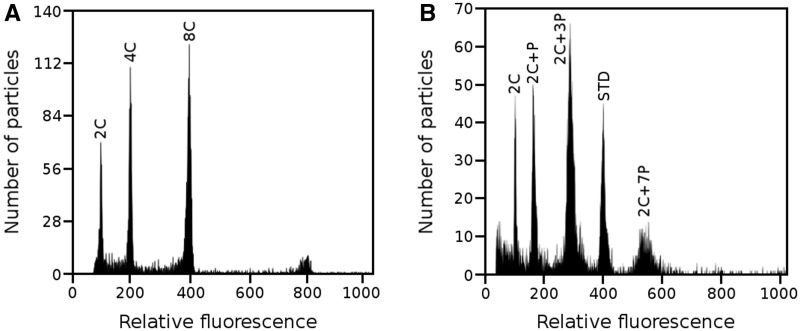
Fig. 1.
Histogram of relative fluorescence intensity obtained after the analysis of propidium iodide-stained nuclei. (A) Nuclei of A. thaliana leaves showing regular endoreduplication. (B) Example of PPE observed in nuclei isolated from an ovary of nonpollinated flower of L. discolor. 2C peak of the internal reference standard (P. sativum cv. Ctirad) is marked as STD. Note that the histograms in panels A and B were obtained using different instrument settings and hence the positions of peaks on x axes do not reflect genome sizes.

