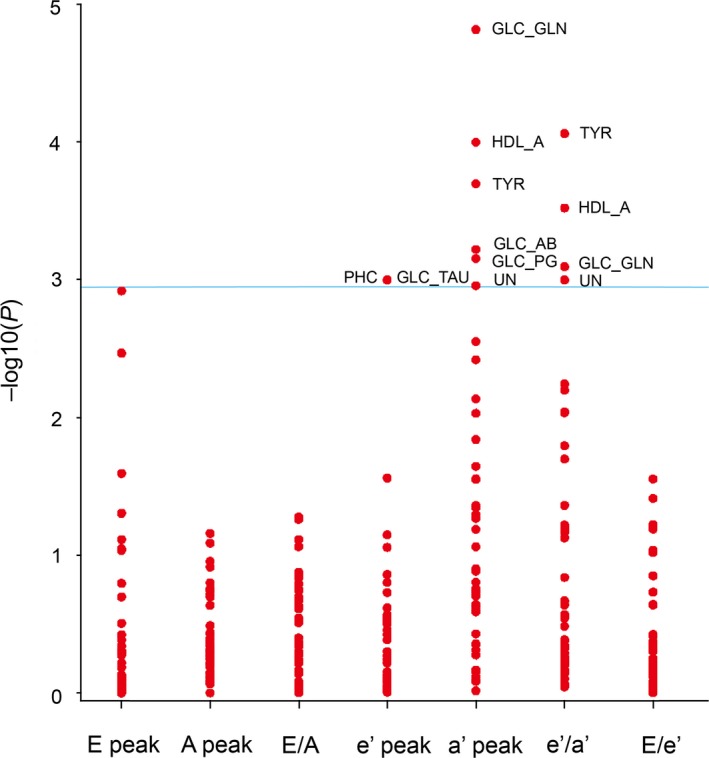
Figure 1.

–Log10(P) probability plot of the multivariable‐adjusted associations of various indexes of diastolic left ventricular dysfunction (see Table 6) with the metabolic biomarkers. TYR, HDL_A, GLC_TAU, PHC, GLC_AB, GLC_GLN, GLC_PG, and UN, respectively, indicate tyrosine, high‐density lipoprotein apolipoproteins, glucose+taurine, phosphocholine, glucose+2‐aminobutyrate, glucose+glutamine, glucose+2‐phosphoglycerate, and unknown molecule. The adjustment accounted for sex, age, body mass index, mean arterial pressure, heart rate, total cholesterol, γ‐glutamyltransferase, fasting plasma glucose, treatment with diuretics, β‐blockers, and inhibitors of the renin‐angiotensin system. The horizontal line denotes the significance level with Bonferroni correction applied.
