
Figure 2.
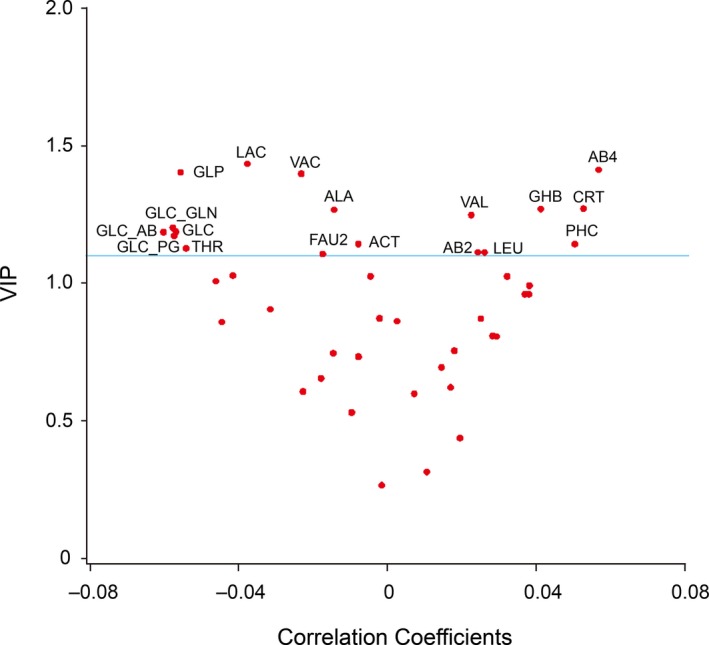
After dichotomizing the study population in 538 participants with normal LV function and 173 with subclinical diastolic LV dysfunction, V‐plots were generated for the PLS‐DA‐derived VIP scores versus the centered and rescaled correlation coefficients. Spots indicating metabolites with a VIP score higher than 1.1 were labeled. Spots associated with normal diastolic LV function (left), ordered by descending VIP score include lactate (LAC), glycoprotein (GLP), valerate (VAC), alanine (ALA), glucose+glutamine (GLC‐GLN), glucose (GLC), glucose+2‐aminobutyrate (GLC‐AB), glucose+2‐phosphoglycerate (GLC‐PG), acetate (ACT), threonine (THR), and fatty acid with –CH=CH (FAU2). Spots associated with diastolic LV dysfunction (right), ordered by ascending VIP score, include leucine (LEU), 2‐aminobutyrate (AB2), phosphocholine (PHC), valine (VAL), 4‐hydroxybutyrate (GHB), creatinine (CRT), and 4‐aminobutyrate (AB4). LV indicates left ventricular; PLS‐DA, partial least square discriminant analysis; VIP, Variable Importance in Projection.