Figure 2.

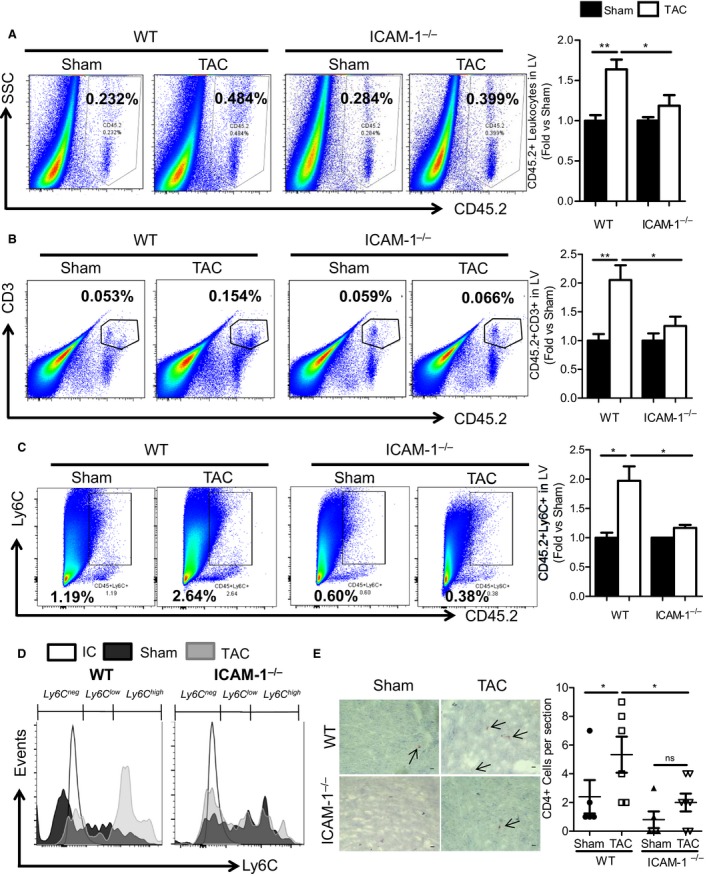
ICAM1‐mediated regulation of CD45.2+, CD3+, CD4+, and Ly6C+ leukocyte infiltration into the LV in response to TAC. A through C, Representative FACS plots of (A) LV CD45.2+ leukocyte, (B) CD3+ T‐cell, and (C) Ly6C+ monocyte infiltration in response to TAC or sham operation at 4 weeks in WT and ICAM1−/− mice. Bar graph on the right represents fold‐change quantification of the indicated leukocytes normalized to sham controls. D, Representative FACS histogram for Ly6C+ low and high subpopulations, gated on CD45.2+ CD11b+ myeloid cells infiltrated into the LV of sham‐ and TAC‐operated WT and ICAM1−/− mice. Ly6Cneg cells represent nonmonocyte myeloid cells, Ly6Clow represents patrolling monocytes, and Ly6Chigh represents proinflammatory monocytes. E, Representative pictures (×40 magnification) of immunohistochemistry staining for CD4+ T helper lymphocytes infiltrated into the LV in sham‐ and TAC‐operated WT and ICAM1−/− mice. Quantification of CD4+ cells per 6‐μm LV cross‐sections is represented. Scale bar=10 μm. n=5 to 7 sham, n=11 TAC. Statistical analysis used the unpaired t test. *P<0.05; **P<0.01. FACS indicates fluorescence‐activated cell sorting; ICAM1, intercellular cell adhesion molecule 1; LV, left ventricle; TAC, transverse aortic constriction; WT, wild type.
